Tracking ACT Internet Connection Strength
===========================================================================
UPTIME KUMA - INTERNET MONITORING DASHBOARD SETUP LOG
Date: 2026-03-29
System: Arch Linux
============================================================================
PLAN
1. Run Uptime Kuma via Docker on port 3001
2. Create admin account
3. Add monitors:
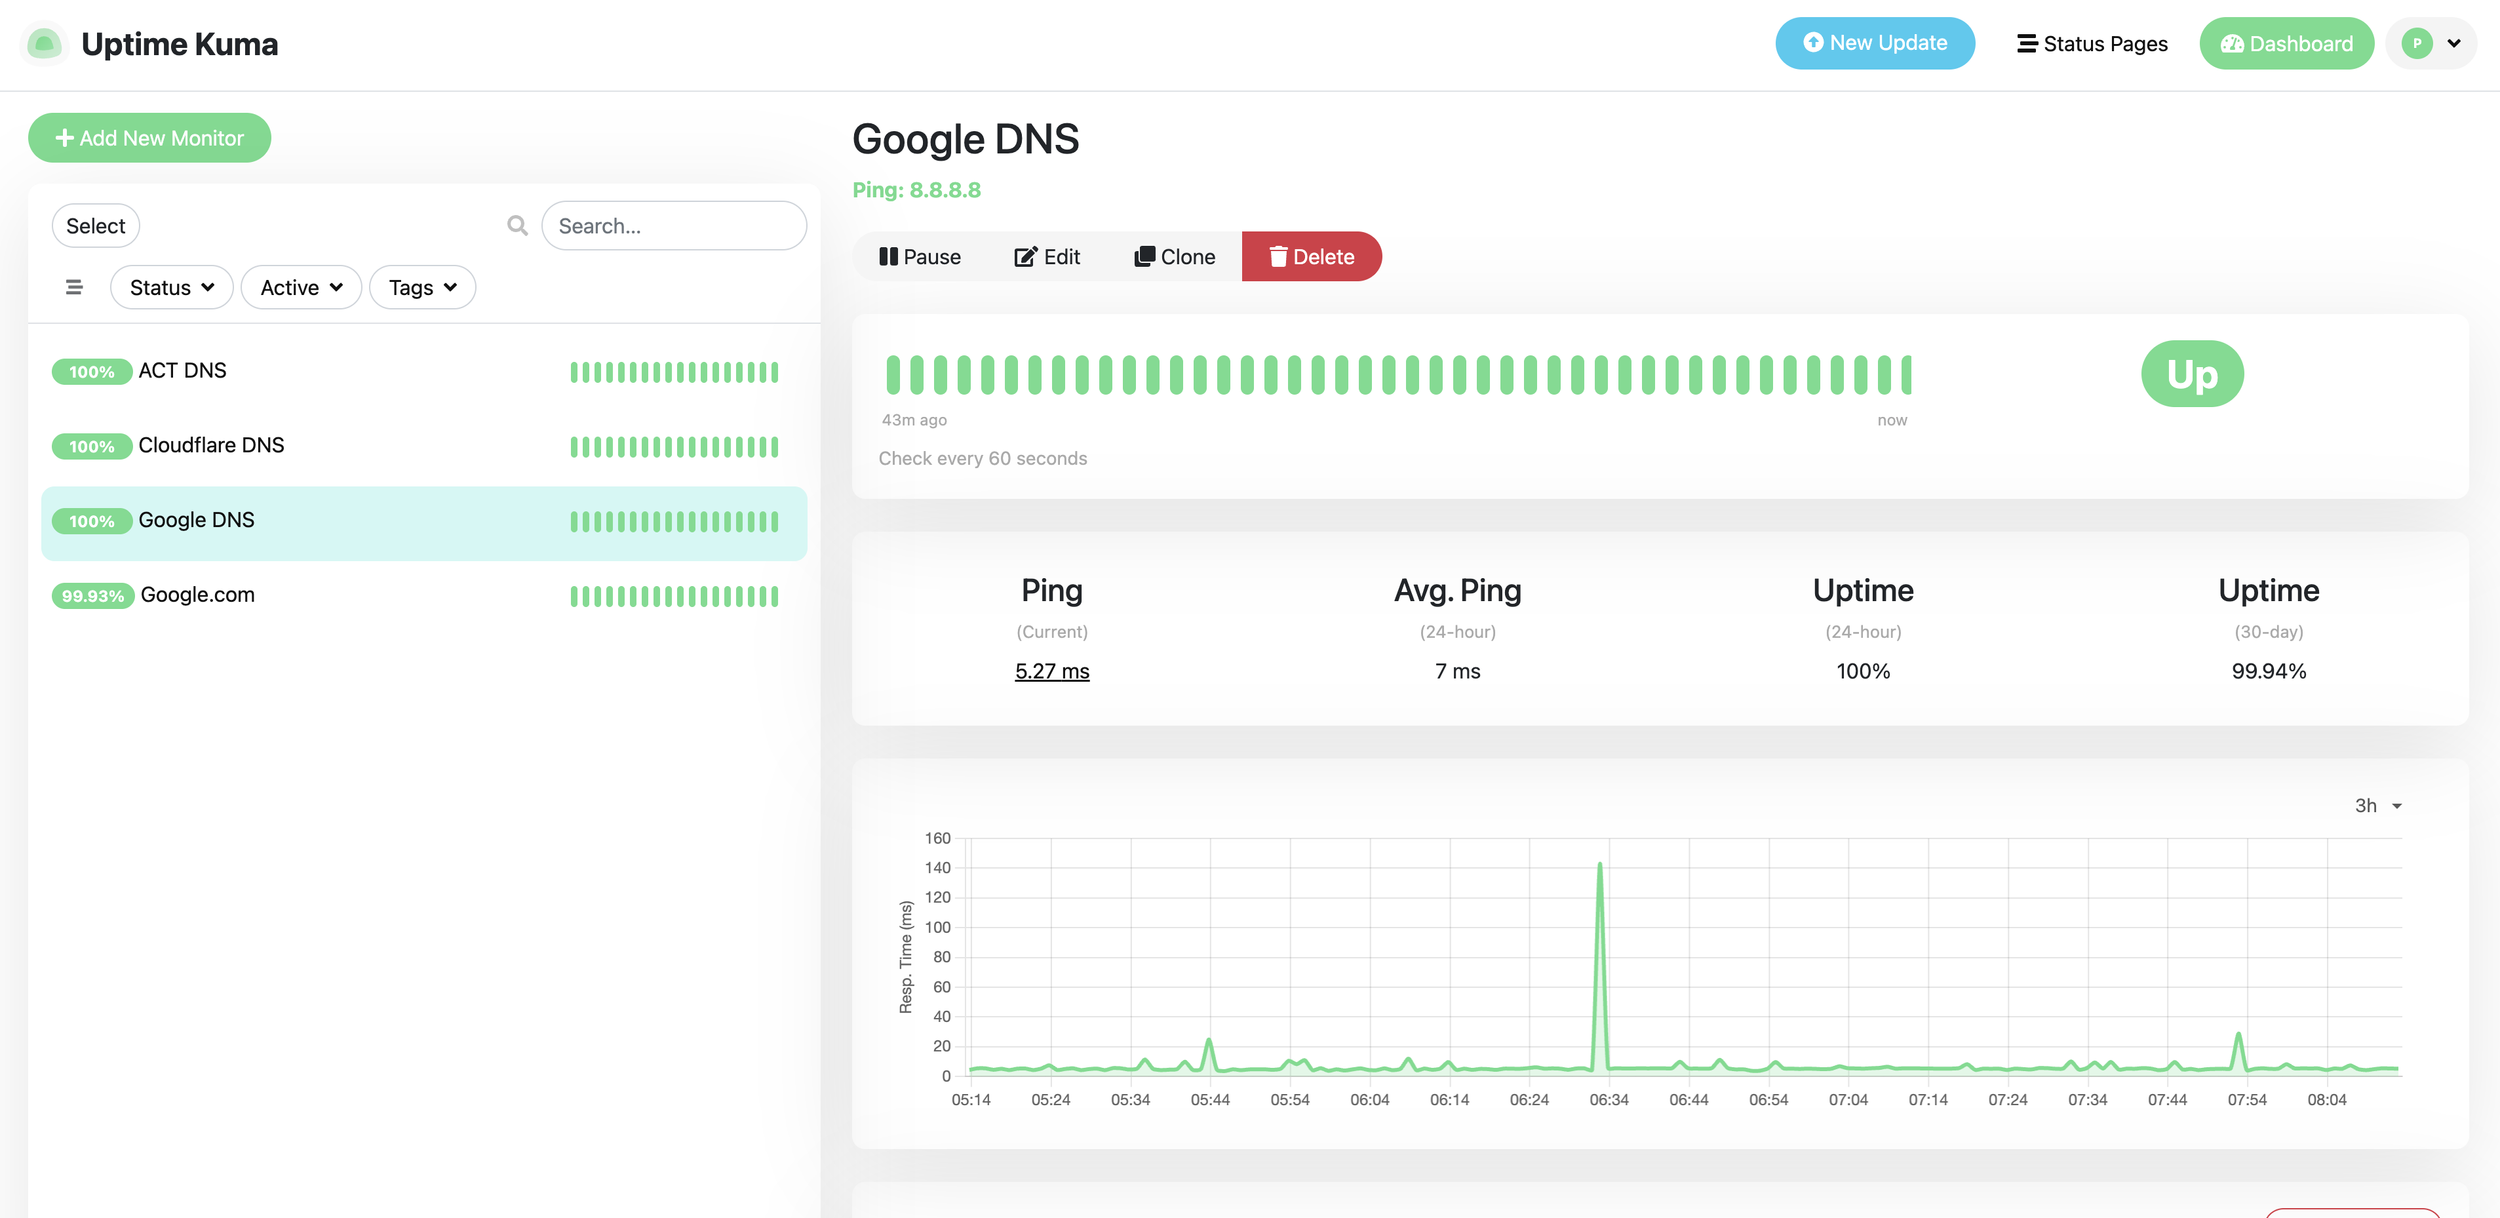
- Ping: 8.8.8.8 (Google DNS)
- Ping: 1.1.1.1 (Cloudflare DNS)
- HTTP: https://google.com
- HTTP: https://actcorp.in
4. Set ping interval to 30 seconds
5. Access dashboard at http://localhost:3001
PENDING / FUTURE ENHANCEMENTS
[*] Add gateway/router monitor (<router ip>) — helps distinguish ISP vs router issues
[ ] Add Telegram notifications — get alerts on phone when internet goes down
[*] Add Tailscale access — view dashboard from phone anywhere
[ ] Add Speedtest Tracker (docker, port 8080) — track download/upload bandwidth over time
[*] Add ACT DNS monitor — once ACT-specific DNS is identified (currently resolv.conf points to router)
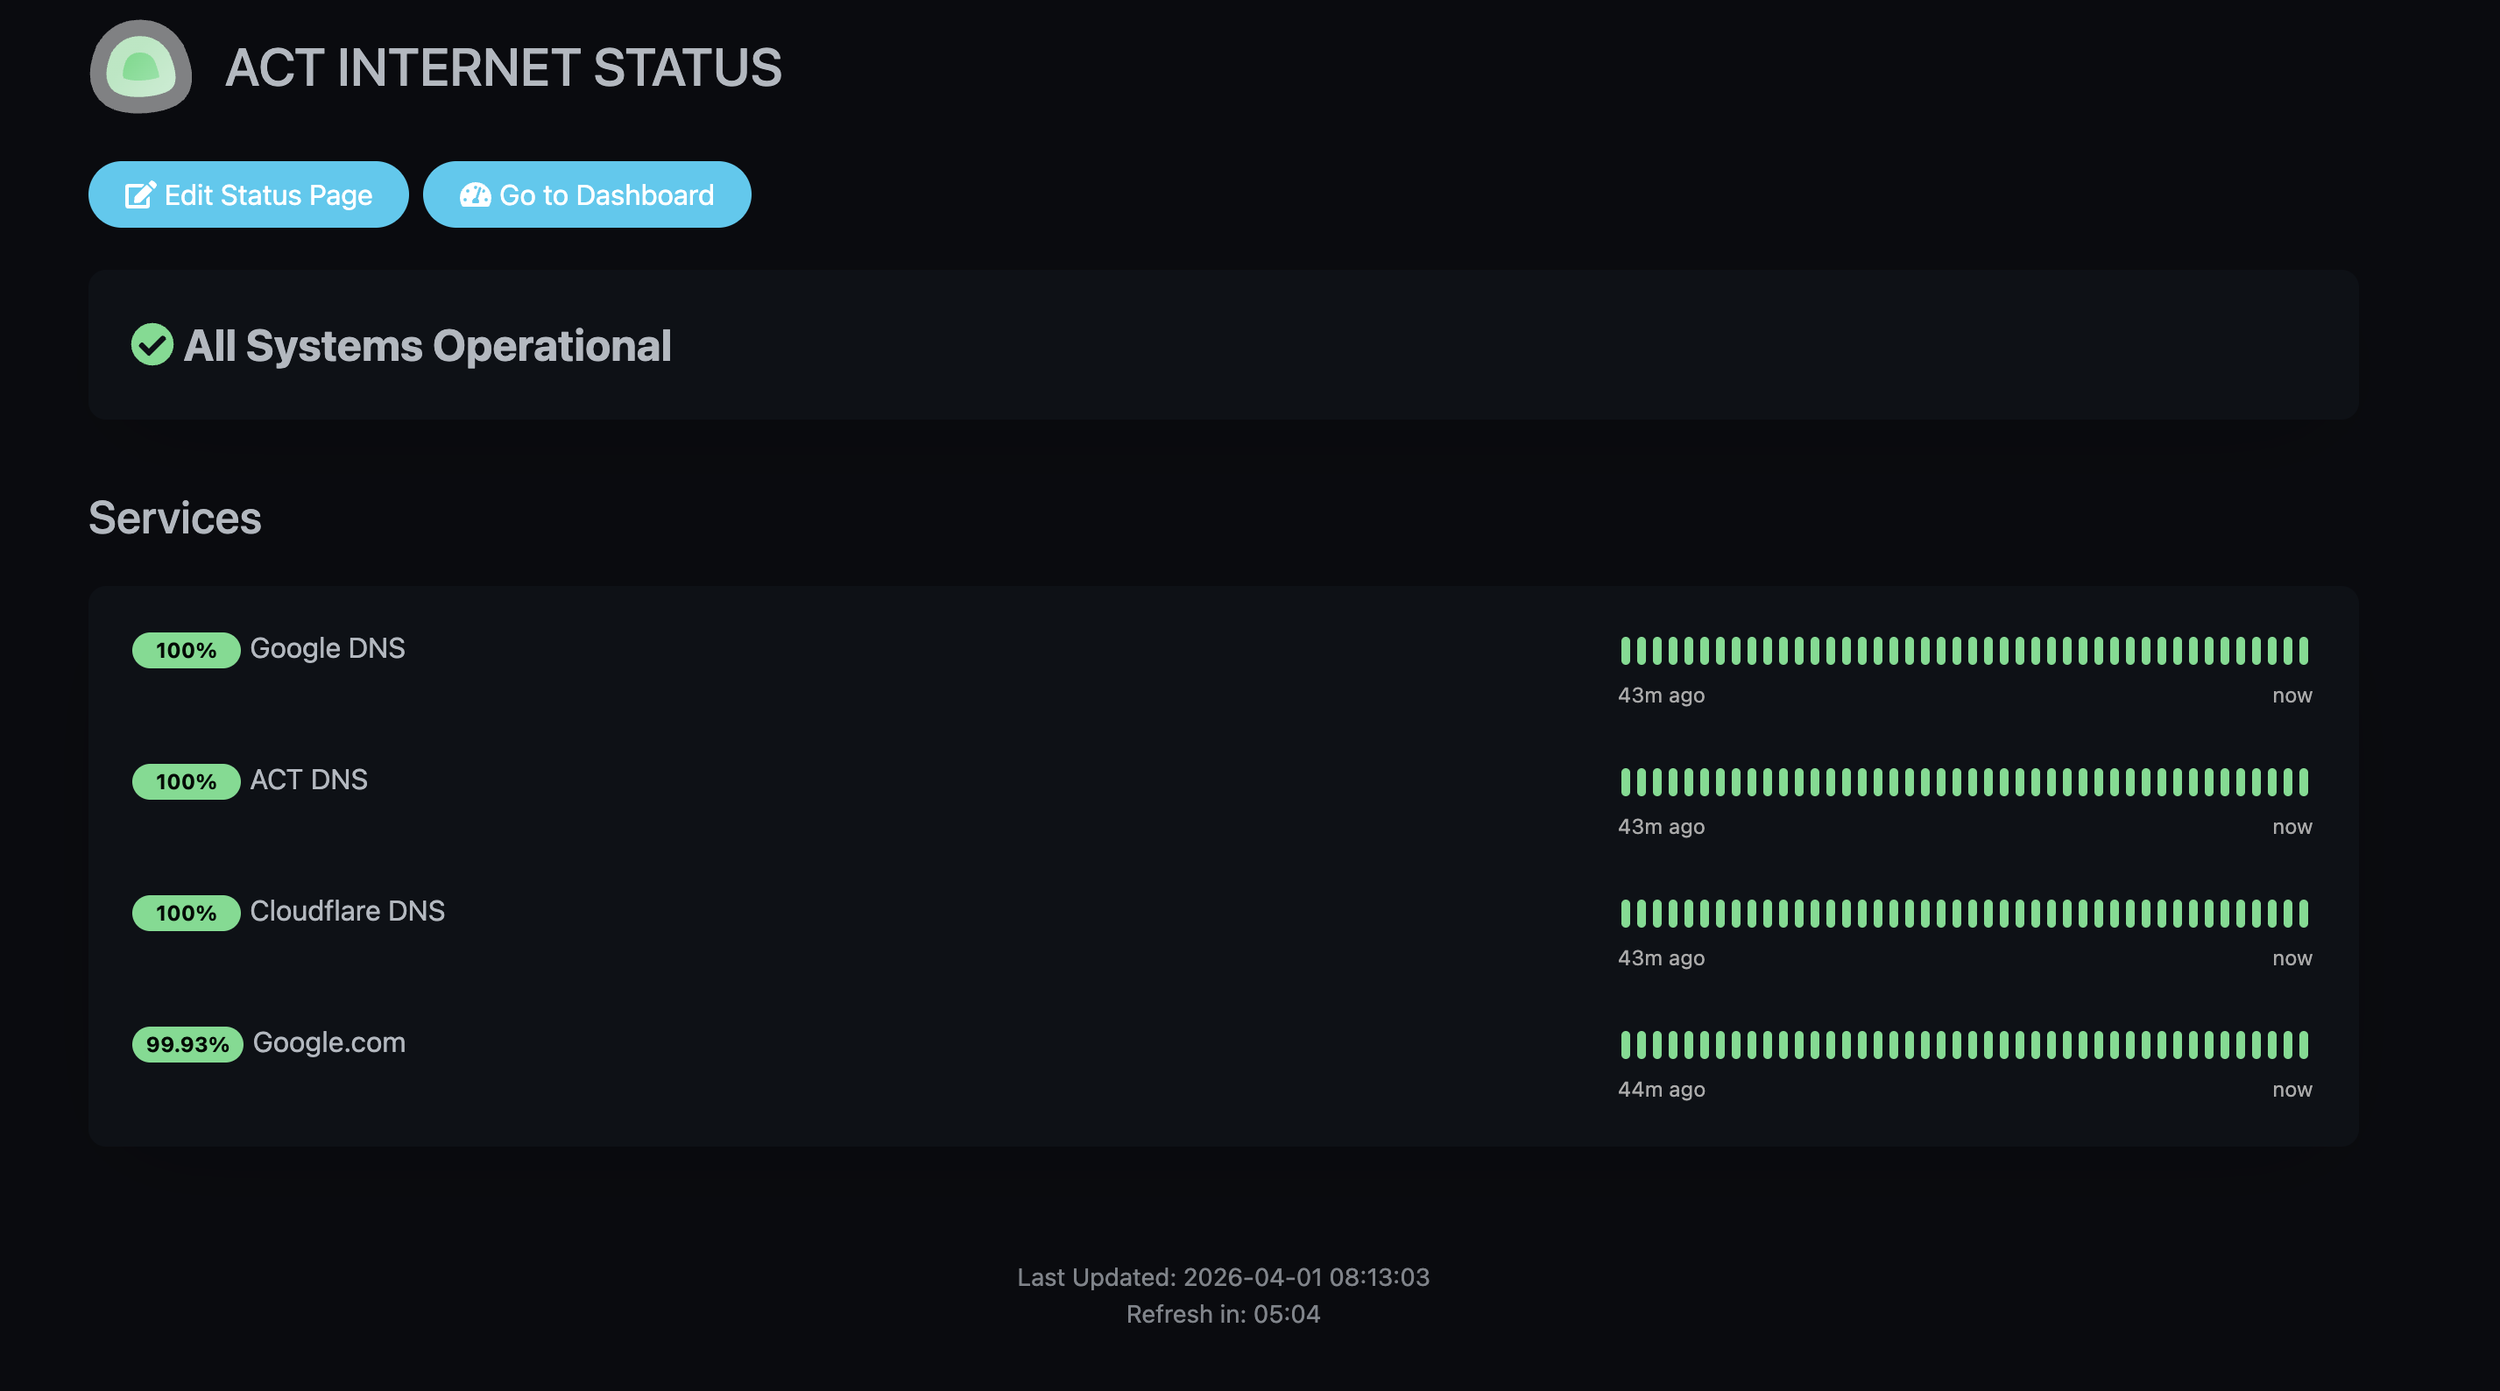
[ ] Create a public status page within Uptime Kuma
[ ] Set up Uptime Kuma backups (docker volume)
=======================================================================
SETUP LOG
=======================================================================
STEP 1: Run Uptime Kuma Docker container
Command:
docker run -d --restart=always -p 3001:3001 \
    -v uptime-kuma:/app/data \
    --name uptime-kuma \
    louislam/uptime-kuma:1
Explanation: Starts Uptime Kuma in background, auto-restarts on reboot, data persists in docker volume.
Status: DONE
Container ID: <Docker Container ID>
Output: Image pulled from louislam/uptime-kuma:1, container started successfully.
STEP 2: Verify container is running
Command:
docker ps | grep uptime-kuma
Explanation: Confirms the container is up and healthy on port 3001.
Status: DONE
Output: Container running, health: starting, port <bound-on-port-3001>
STEP 3: Create admin account
Action: Open http://localhost:3001 in browser, create username and password.
Explanation: First-time setup requires creating an admin account via the web UI.
Status: DONE — user needs to do this in browser
STEP 4: Add monitors (do this after Step 3 in the web UI)
Monitor 1: Type=Ping, Name="Google DNS", Hostname=8.8.8.8, Interval=30s
Monitor 2: Type=Ping, Name="Cloudflare DNS", Hostname=1.1.1.1, Interval=30s
Monitor 3: Type=HTTP, Name="Google Website", URL=https://google.com, Interval=30s
Monitor 4: Type=HTTP, Name="ACT Website", URL=https://actcorp.in, Interval=30s
Explanation: These monitors run every 30 seconds and track latency + uptime.
Status: DONE — user needs to add these in the web UI
STEP 5: Verify dashboard is collecting data
Action: Wait 1-2 minutes, check http://localhost:3001 for live graphs.
Explanation: After adding monitors, data starts flowing immediately.
Status: DONE
USEFUL COMMANDS
---------------
docker ps | grep uptime-kuma — Check if container is running
docker logs uptime-kuma — View container logs (for troubleshooting)
docker stop uptime-kuma — Stop the container
docker start uptime-kuma — Start the container
docker restart uptime-kuma — Restart the container