Built a Personal Swiggy Order Analytics Tool
A story about reverse-engineering a food delivery app, fighting AWS firewalls, and learning more about my biryani habit than I probably needed to.
The Idea
It started with a simple question: how much am I actually spending on Swiggy?
I knew it was "a lot" — but I had no idea how much, on what, from where, or whether I was getting any real value from those discounts that flash green every time I checkout. I wanted real numbers. Charts. Patterns.
Swiggy has an in-app order history, but it's a scrollable list — no aggregation, no insights, no exports. So I decided to build my own.
The goal was simple: pull my order history into a database, run it through pandas, and generate some honest statistics about my food delivery habits.
Project Structure
Before writing a single line, I thought about how to keep things clean. The project ended up with two clear responsibilities:
swiggy-order-analytics/
├── auth.py          ← handles Swiggy login and session
├── fetch.py         ← pulls orders from API, stores in SQLite
├── analyze.py       ← loads data, runs analysis, writes charts
├── analysis.md      ← generated report with observations
├── charts/          ← all generated chart images
├── .env             ← your session cookies (never committed)
├── .env.example     ← template showing what goes in .env
└── .gitignore       ← keeps swiggy.db and .env off git
The fetch step and the analysis step are intentionally separate. You fetch once, then iterate on analysis as many times as you want without hitting the API again. Clean separation of concerns.
Step 1: Finding the API
Swiggy doesn't have a public API. But every time you open your order history on swiggy.com, your browser is calling something. So I opened Chrome DevTools, went to the Network tab, and watched what happened when I clicked "Orders".
There it was:
A JSON response with a paginated list of orders — each one containing restaurant name, order total, timestamp, and a full breakdown of every item including prices, GST, discounts, and food categories.
Pagination works using the last order_id as a cursor:
Each page returns 5 orders. To get all orders, you keep requesting the next page until you get an empty list back.
Simple enough. Or so I thought.
Step 2: Authentication — More Complicated Than Expected
The orders endpoint requires you to be logged in. Swiggy uses an OTP-based login flow, and looking at the network requests, the sequence was:
GET swiggy.com → get a csrfToken from the page HTML and a __SW cookie from the response
POST dapi/auth/sms-otp with your mobile number, the CSRF token, and the __SW cookie in headers
GET swiggy.com again → Swiggy rotates the CSRF token after OTP send, so you need a fresh one
POST dapi/auth/otp-verify with the OTP and the new CSRF token
Done — the session now carries authenticated cookies
A few things that weren't obvious:
The __SW cookie must be passed explicitly in the OTP send request headers, not just through the session. Without it, the request silently fails — Swiggy returns 200 but does nothing.
The CSRF token is rotated between the OTP send and OTP verify steps. You have to fetch a fresh one in between, or verification fails.
Swiggy returns HTTP 200 for error responses, so you can't rely on status codes alone. You have to inspect the JSON body for error codes.
I wrote auth.py with two clean functions: request_otp(phone) and verify_otp(session, otp). The session object is passed between them, carrying the cookies through the entire flow.
Hurdle 1: The AWS WAF
After writing the auth flow, I ran the script and hit an immediate wall:
Debugging showed the actual problem: the response body was completely empty. Status 202. Zero bytes.
Swiggy had deployed AWS WAF (Web Application Firewall) in front of their site. Any request that didn't come from a real browser was being intercepted and returned as a challenge — an empty 202 with this header:
The WAF challenge requires JavaScript execution to solve, which a requests.Session simply cannot do. A real browser handles it invisibly; a Python script never gets past it.
The OTP login flow was dead.
The Fix: Browser Cookies
The workaround was straightforward once I accepted that authentication had to happen in a real browser:
Log in to swiggy.com normally in Chrome
Open DevTools → Network tab → click any request to /dapi/order/all
In the Request Headers, find the Cookie header — copy the entire value
That cookie string contains everything: the session token, device ID, the __SW cookie, and crucially, the aws-waf-token that proves a real browser solved the WAF challenge.
This goes into a .env file that is gitignored and never committed. The script reads it at runtime. Treat it like a password — it's essentially a temporary login credential for your Swiggy account.
With the cookie injected into the requests.Session, every API call went through without issues.
Hurdle 2: The Pagination Limit
With authentication solved, I ran the fetch and got:
The API hard-stops at 45 orders regardless of what total_orders: 999 says. That 999 is almost certainly a display cap — Swiggy's way of showing "999+" without revealing the actual count.
The web API simply doesn't expose your full order history. This is a deliberate server-side limit, not a bug in the pagination logic. After page 9, the cursor returns an empty list and there's no way around it through the web endpoint.
What this means for the analysis: everything here is based on your most recent ~44 delivered orders. Older orders are inaccessible through this approach. The patterns are real but the window is narrow.
Aside: Could the Mobile App API Go Deeper?
One idea worth mentioning: the Swiggy app likely talks to a different API endpoint than the web version. In theory, you could intercept that traffic using an HTTPS proxy (mitmproxy, Charles, Proxyman) — set your Mac as the Wi-Fi proxy, install the proxy's CA certificate on your phone, open Swiggy, navigate to order history, and watch what requests come through.
The interesting question: does the mobile endpoint use a different pagination model — a nextPageToken, a from_time, or a higher limit — that could unlock the full order history?
We didn't go down this route for a few reasons. First, Swiggy may use certificate pinning, which would make the app refuse to connect entirely when a proxy certificate is installed — a dead end without more invasive tooling. Second, if the app itself only shows recent orders, the mobile API likely has the same server-side cap. Third, it's worth checking simpler alternatives first: does Swiggy send order confirmation emails that could be parsed? Does support offer a data export? Those are lower-effort paths to the same goal.
For this project, the 44-order window was enough to find real patterns. If you want historical data badly enough, the mobile proxy route is the next thing to try.
The Database
With the data in hand, I stored it in a local SQLite database with two tables:
orders — one row per delivered order:order_id, order_total, restaurant_name, order_time, order_status, rain_mode, on_time
order_items — one row per item in each order:order_id, item_name, is_veg, quantity, base_price, final_price, subtotal, total, effective_item_price, item_total_discount, packing_charges, gst, service_charges, service_tax, category, veg_classifier
A few design decisions worth noting:
Only Delivered orders are saved. Cancelled or failed orders are downloaded but discarded.
INSERT OR IGNORE on orders + per-order rowcount check means re-running the script never duplicates data.
Items are only inserted when the parent order is new — if an order already exists, its items are skipped entirely. This avoids the subtle bug where a cumulative insert counter would let old orders' items get re-attempted on subsequent runs.
The Analysis Stack
With swiggy.db ready, the analysis runs entirely from analyze.py:
The script loads both tables into DataFrames, runs 13 analyses, saves charts to charts/, and writes a full analysis.md report — all in one shot. No manual steps.
Everything follows the same pattern: 1. Compute the metric from the DataFrame 2. Write the observation and interpretation to the markdown 3. Generate and save the chart 4. Flag anything statistically suspect
What We Captured (and What We Missed)
What's in the data: - Order totals, timestamps, restaurant names - Every item with full price breakdown (base, final, discount, GST, packing) - Food category from Swiggy's catalog - Veg / Non-veg / Egg classifier per item - Rain mode and on-time delivery flags per order
What's not in the data: - Order-level coupons — codes like SWIGGYIT applied at checkout don't show up in item_total_discount. Actual savings are likely higher than what we captured. - Delivery fees — charged at the order level, not reflected in item-level data. The gap between order_total and sum of item totals is partly explained by this. - Historical orders — anything older than the most recent ~45 orders is inaccessible. - Ratings and reviews — not in the order history API response.
Lessons Learned
On reverse-engineering APIs: Unofficial APIs are fragile by nature. The endpoint, the required cookies, the CSRF rotation behaviour, or the WAF rules can change at any time without notice. This tool works as of the time it was built — it may need updating if Swiggy changes their auth flow.
On small samples: 44 orders sounds like a lot until you start slicing it by day of week, restaurant, and food category. Suddenly you have bars with 1–2 data points and the temptation to over-interpret is real. Every chart in the analysis includes a flag for this. Descriptive statistics on small samples describe what happened, not what you tend to do.
On cookies and security: Session cookies are login credentials. The .env file that holds them is gitignored, never logged, never printed. If you're building something similar: treat cookies like passwords, because that's exactly what they are.
Running It Yourself
Dependencies: requests, pandas, matplotlib, seaborn, numpy
Swiggy Order Analysis
Dataset: 44 delivered orders · 102 items Period: 09 May 2025 → 25 Apr 2026 Generated: 2026-05-06 11:36
⚠️ Statistical caveat: n=44 is a small sample. All observations are descriptive only — patterns here reflect recent ordering history, not long-term behaviour. Treat percentages and rankings as indicative, not conclusive.
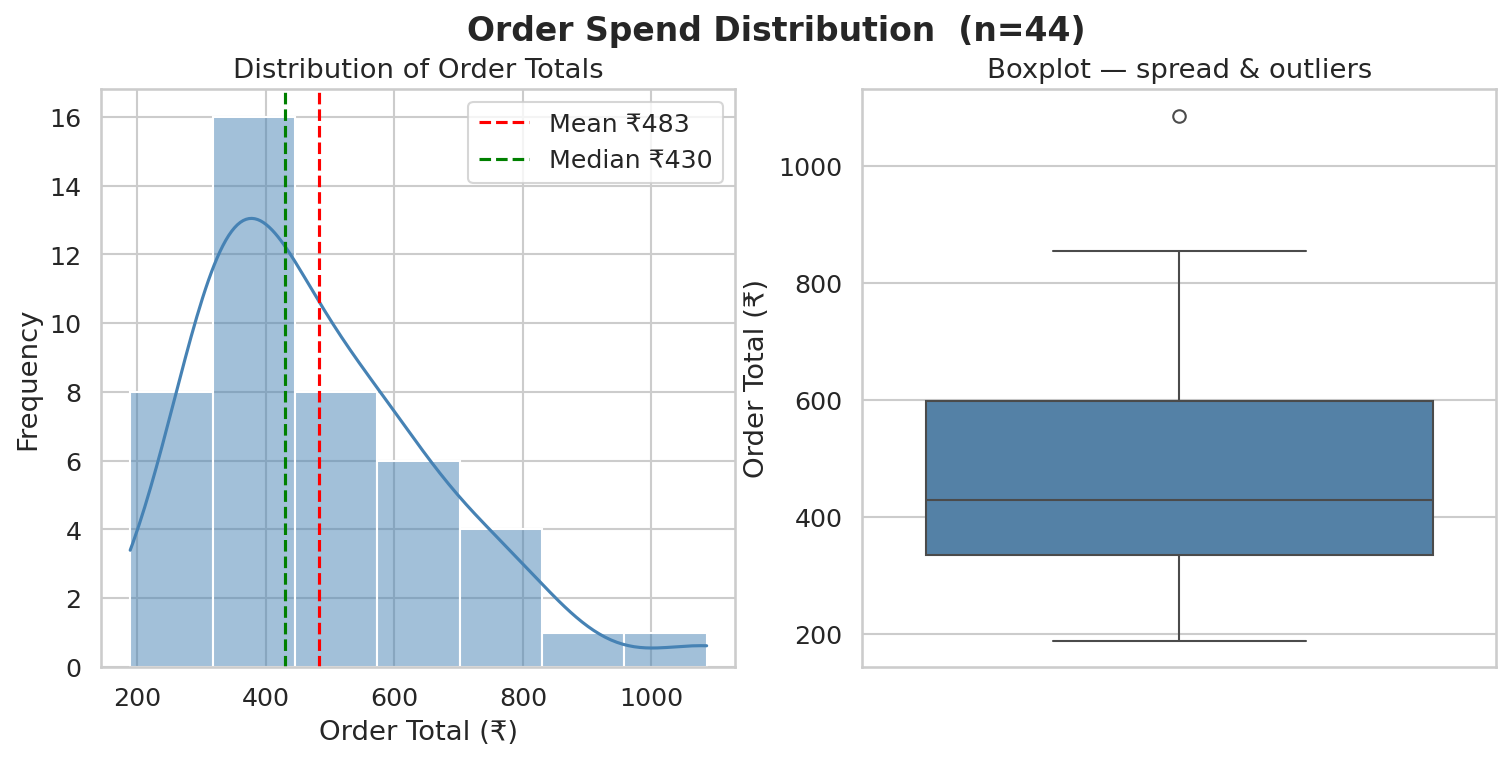
1. Spending Summary
| Metric | Value |
|---|---|
| n (orders) | 44 |
| Total Spent (₹) | 21237.00 |
| Mean (₹) | 482.66 |
| Median (₹) | 430.00 |
| Std Dev (₹) | 182.53 |
| IQR (₹) | 263.00 |
| Min (₹) | 189.00 |
| Max (₹) | 1086.00 |
| Q1 (₹) | 336.00 |
| Q3 (₹) | 599.00 |
| Skewness | 1.125 |
| Excess Kurtosis | 1.473 |
Observation: Mean (₹483) exceeds median (₹430) — the distribution is right-skewed (skewness = 1.13), pulled upward by a few large orders. The IQR (₹263) captures the middle 50% of orders, ranging from ₹336 to ₹599.
Interpretation: Total spend of ₹21237 across 44 orders. A high standard deviation (₹183) relative to the mean signals meaningful variability — not every order is the same size, and occasional splurges are visible.
⚠️ Mean and median diverge by ₹53 — report median as the typical order value, not mean. ⚠️ n=44 — a single high-value outlier order shifts both mean and std dev noticeably.
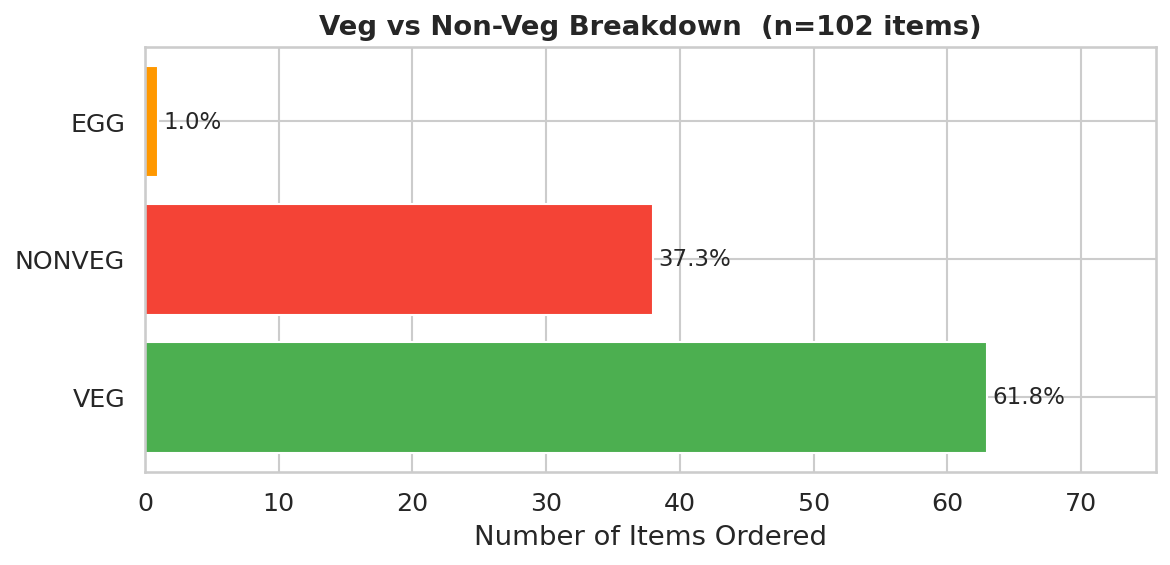
2. Veg vs Non-Veg Breakdown
| Category | Count | Percentage (%) |
|---|---|---|
| VEG | 63 | 61.8 |
| NONVEG | 38 | 37.3 |
| EGG | 1 | 1.0 |
Additionally: 27 of 44 orders (61%) contained at least one non-veg item.
Observation: VEG is the dominant category at 61.8% of all items ordered. 27 orders (61%) included at least one non-veg item.
Interpretation: A veg-forward ordering pattern is consistent across the history. Non-veg items appear occasionally but are not the primary choice.
⚠️ This counts item rows, not orders. An order with 3 veg items and 1 non-veg contributes 3 to VEG — inflating the veg share without reflecting intent. Always cross-reference with the order-level count above.
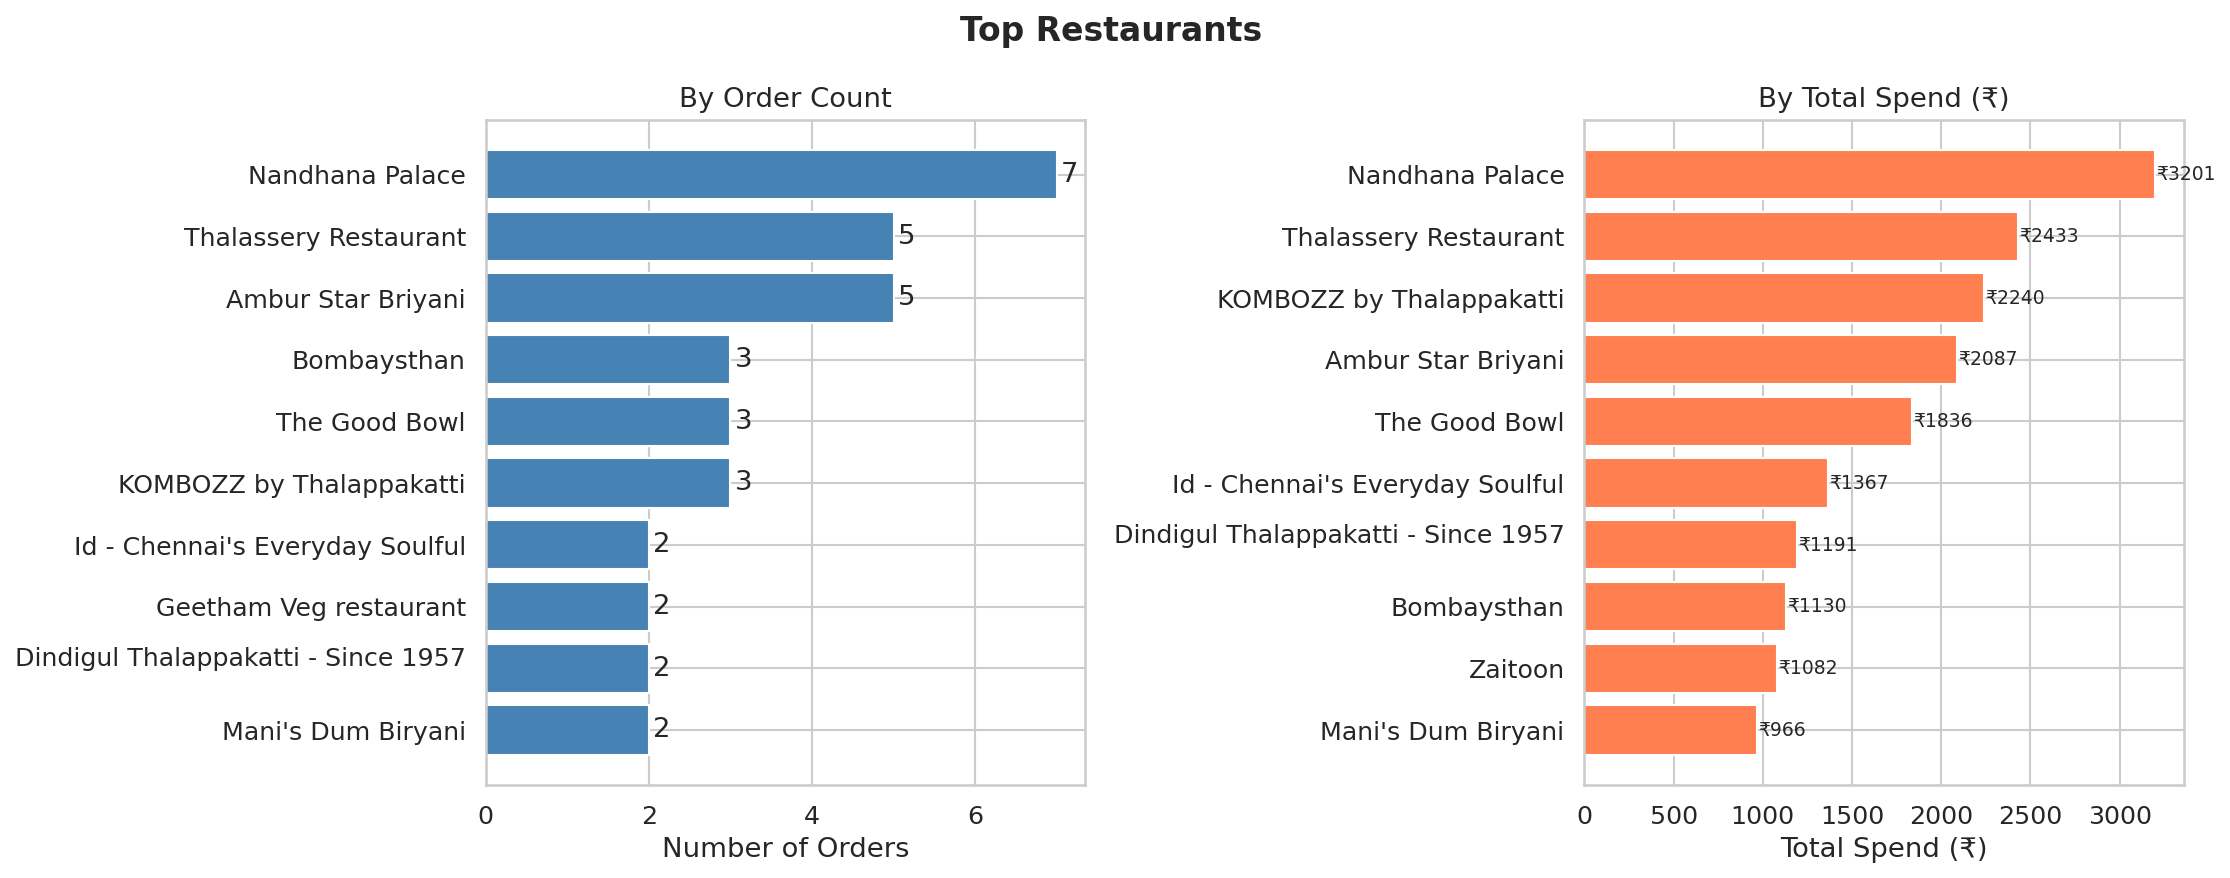
3. Top Restaurants
| Restaurant | Orders | Total Spend (₹) | Avg Order (₹) |
|---|---|---|---|
| Nandhana Palace | 7 | 3201.0 | 457.29 |
| Ambur Star Briyani | 5 | 2087.0 | 417.4 |
| Thalassery Restaurant | 5 | 2433.0 | 486.6 |
| Bombaysthan | 3 | 1130.0 | 376.67 |
| KOMBOZZ by Thalappakatti | 3 | 2240.0 | 746.67 |
| The Good Bowl | 3 | 1836.0 | 612.0 |
| Mani's Dum Biryani | 2 | 966.0 | 483.0 |
| Dindigul Thalappakatti - Since 1957 | |||
| 2 | 1191.0 | 595.5 | |
| Id - Chennai's Everyday Soulful | 2 | 1367.0 | 683.5 |
| Geetham Veg restaurant | 2 | 558.0 | 279.0 |
| Zaitoon | 2 | 1082.0 | 541.0 |
| Sizzling Curries The Kulambu Kadai | 2 | 717.0 | 358.5 |
| Chai Galli | 1 | 338.0 | 338.0 |
| Geetham Sweets, Savouries and Chaats | 1 | 317.0 | 317.0 |
| ITC Aashirvaad Soul Creations | 1 | 758.0 | 758.0 |
| ITC Master Chef Creations | 1 | 413.0 | 413.0 |
| Pizza Hut | 1 | 330.0 | 330.0 |
| Vaishno Thali | 1 | 273.0 | 273.0 |
Observation: 'Nandhana Palace' leads by order frequency. 'Nandhana Palace' accounts for the highest cumulative spend. 12 of 18 restaurants were ordered from more than once.
Interpretation: Repeat orders signal habit or strong preference. A restaurant with high total spend but few orders suggests premium pricing — worth checking if value matches cost. Restaurants ordered only once may have been one-off explorations.
⚠️ With 44 orders across 18 restaurants, most appear only once. "Top restaurant" here is a weak signal — even 2 orders is statistically marginal. Rankings will stabilise with a larger order history.
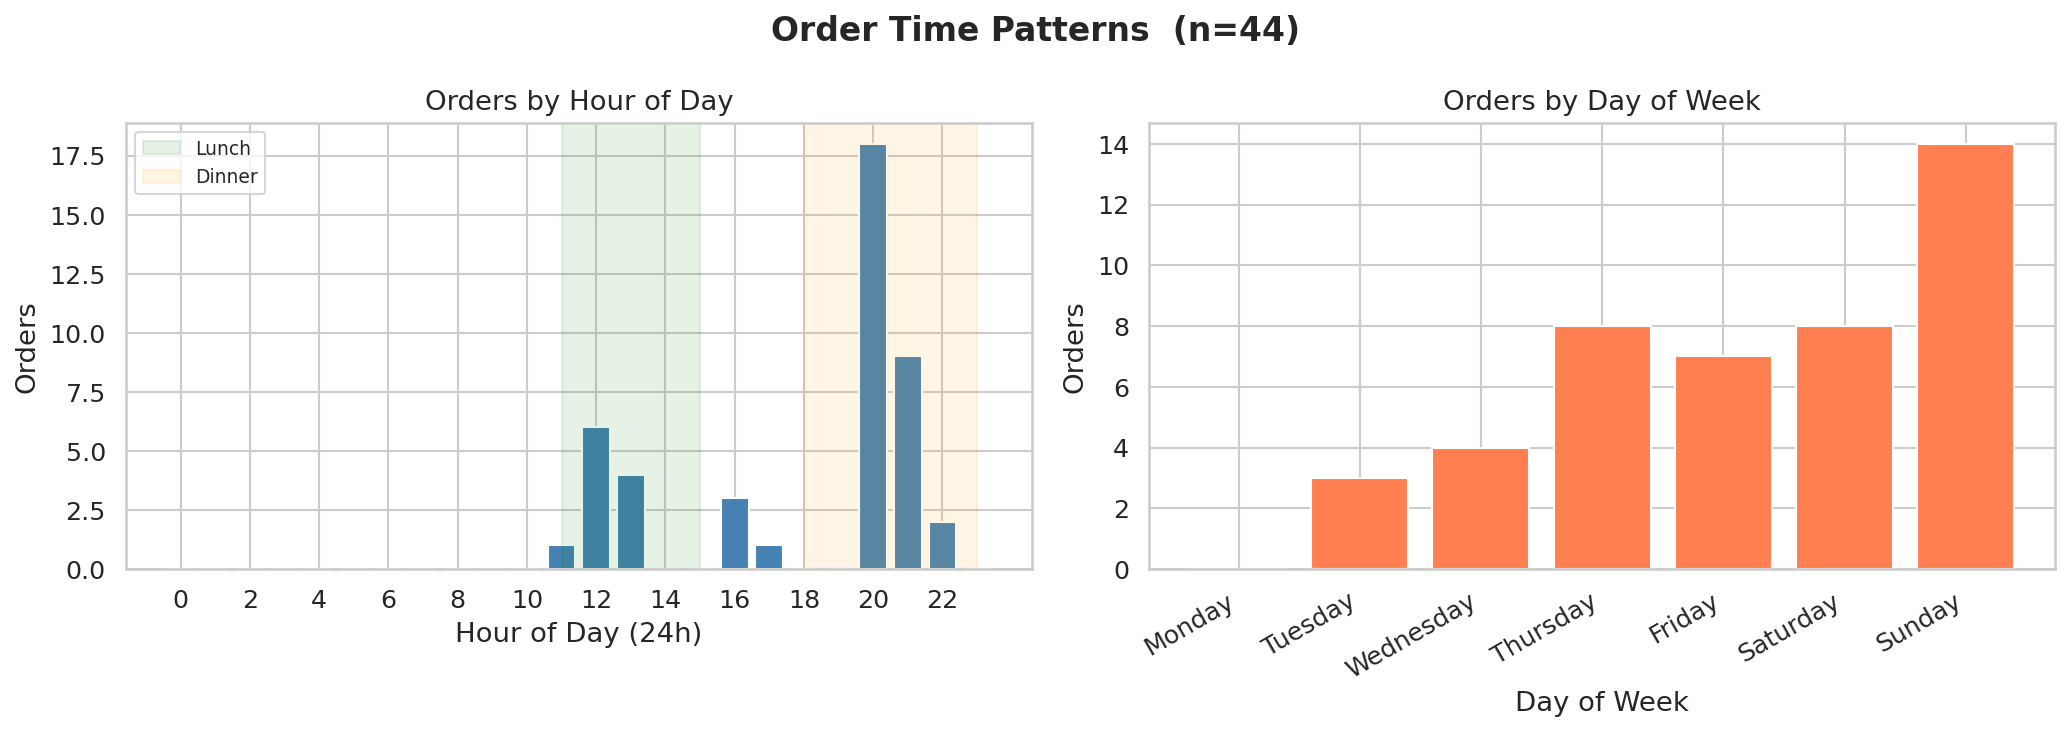
4. Order Time Patterns
Orders by meal period:
| Meal Period | Orders |
|---|---|
| Breakfast (6–10) | 0 |
| Lunch (11–14) | 11 |
| Snacks (15–17) | 4 |
| Dinner (18–22) | 29 |
| Late Night (23–5) | 0 |
Observation: Peak ordering hour is 20:00, peak day is Sunday, and Breakfast (6–10) is the dominant meal period with 0 orders.
Interpretation: Orders cluster around Breakfast (6–10) — suggesting this is the primary use case for Swiggy in this dataset. The day-of-week pattern can reveal whether delivery is a weekday convenience or weekend treat.
⚠️ With 44 orders, each hour-of-day or day-of-week bar represents very few observations (some as low as 1–2). Do not over-interpret the shape of these distributions — they will shift materially with more data.
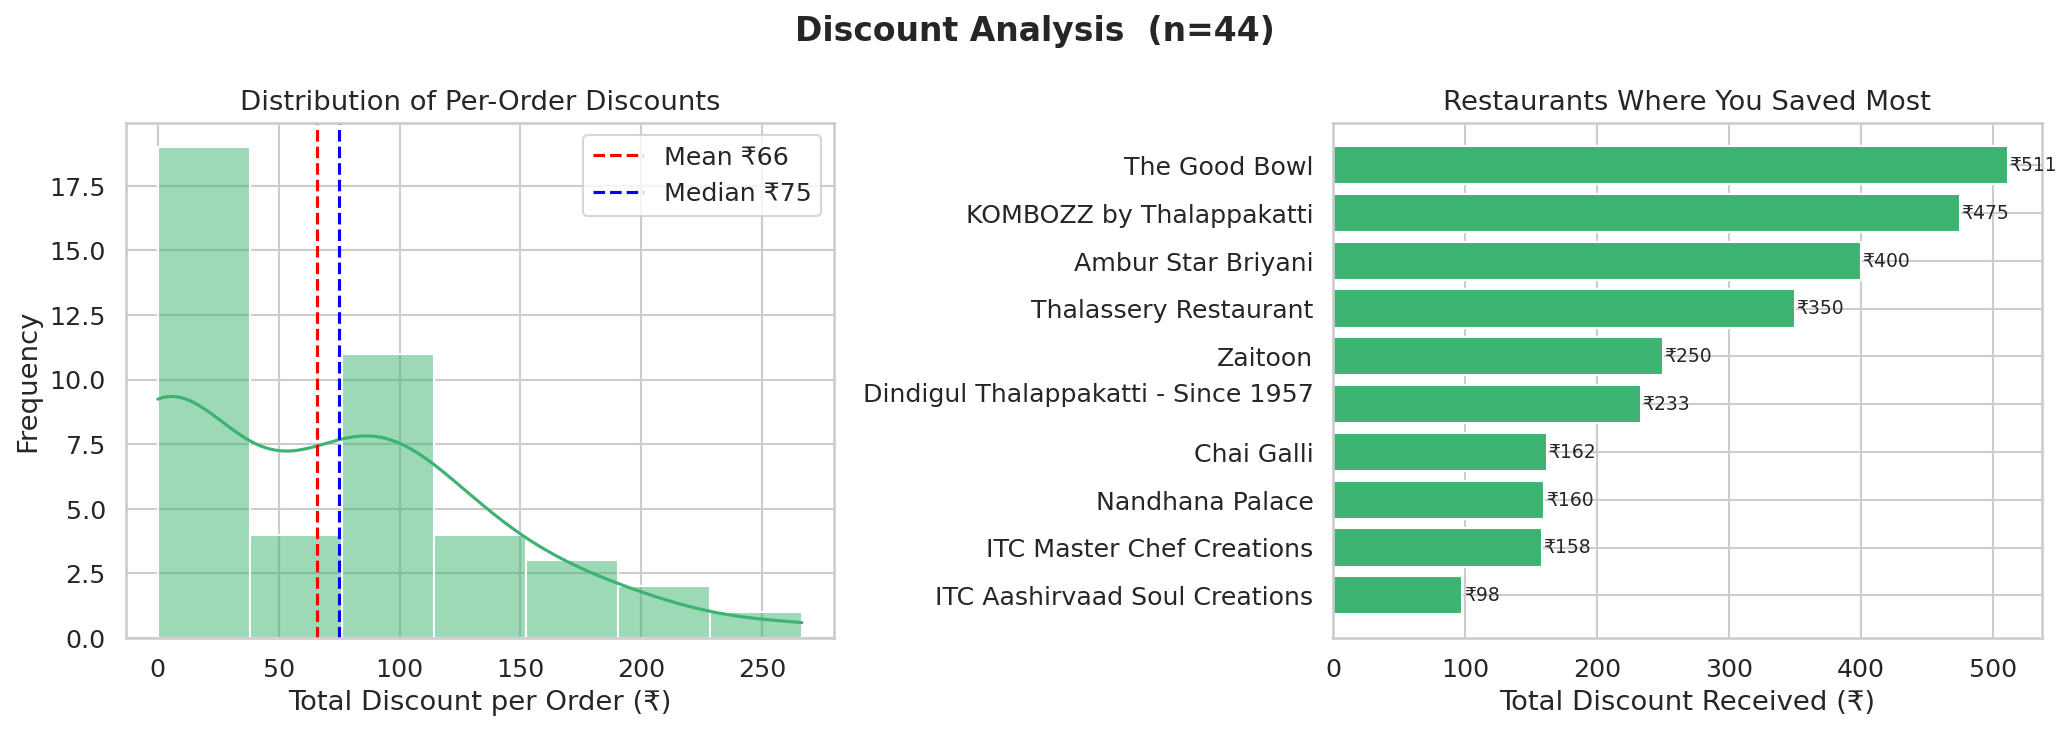
5. Discount Analysis
| Metric | Value |
|---|---|
| Total Discount Received (₹) | ₹2905.45 |
| Avg Discount per Order (₹) | ₹66.03 |
| Median Discount per Order (₹) | ₹74.99 |
| Orders with Discount | 26 of 44 |
| % Orders with any Discount | 59.1% |
| Avg Discount % (on discounted orders) | 21.6% |
Restaurants where you saved the most:
| Restaurant | Total Discount (₹) |
|---|---|
| The Good Bowl | 511.37 |
| KOMBOZZ by Thalappakatti | 474.95 |
| Ambur Star Briyani | 399.97 |
| Thalassery Restaurant | 349.94 |
| Zaitoon | 249.99 |
| Dindigul Thalappakatti - Since 1957 | |
| 233.45 | |
| Chai Galli | 161.99 |
| Nandhana Palace | 160.0 |
| ITC Master Chef Creations | 158.0 |
| ITC Aashirvaad Soul Creations | 98.0 |
Observation: ₹2905 saved in total across 44 orders. 26 of 44 orders (59%) received at least one item-level discount. Mean discount (₹66) exceeds median (₹75), indicating a right-skewed distribution driven by a few heavily discounted orders.
Interpretation: Discounts are present but moderate. The mean and median are close, suggesting consistent rather than sporadic promotional activity.
⚠️ item_total_discount captures item-level offer discounts only.
Order-level coupons (e.g., SWIGGYIT, TRYNEW codes) applied at checkout
are not reflected in this field — actual savings may be higher.
Interpret total discount as a lower bound.
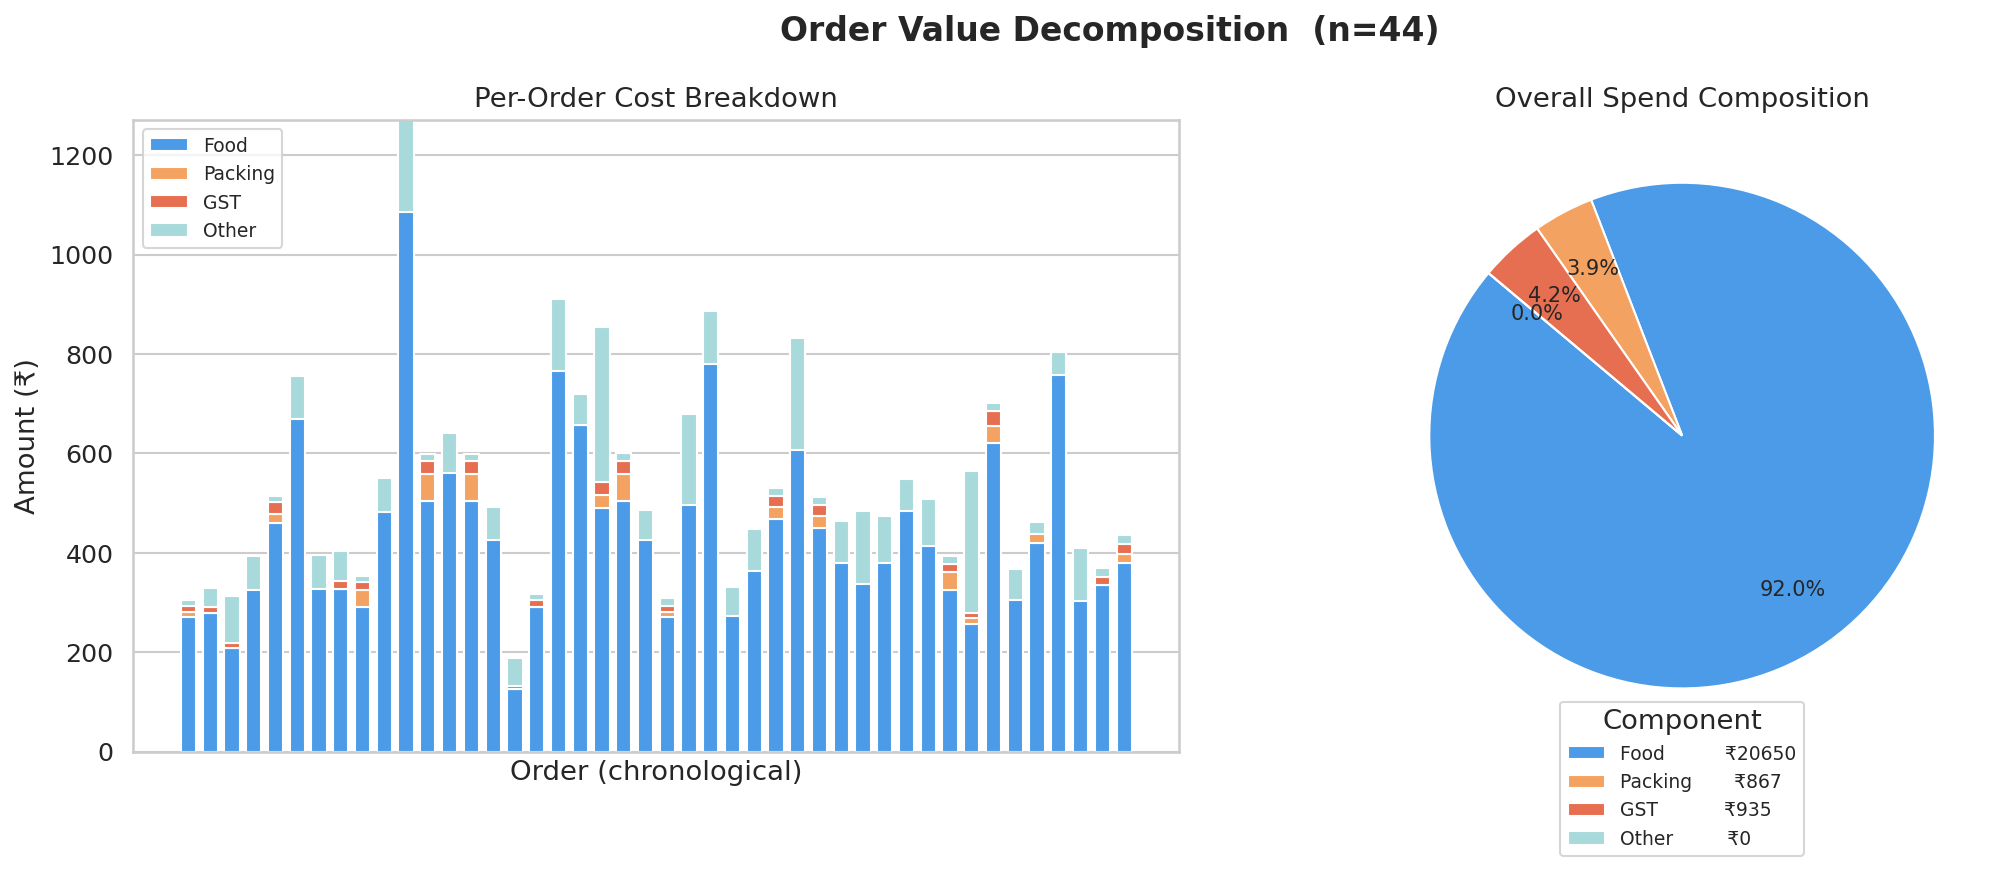
6. Order Value Decomposition
| Component | Total (₹) | Share (%) |
|---|---|---|
| Food (subtotal) | ₹20650.10 | 97.2% |
| Packing Charges | ₹866.96 | 4.1% |
| GST | ₹934.99 | 4.4% |
| Other / Unaccounted | ₹-1215.05 | -5.7% |
Observation: Food (subtotal) accounts for 97.2% of total spend (₹20650). Packing charges contribute 4.1% (₹867) and GST 4.4% (₹935). The remaining -5.7% (₹-1215) is unaccounted at item level — likely delivery fees or platform charges applied at the order level.
Interpretation: The bulk of spend is food cost — fees and taxes are a relatively small add-on in this dataset. The "Other" component, if large, warrants checking whether delivery fees are being captured in the raw order data but not at the item level.
⚠️ subtotal at item level = base_price × quantity, before discounts.
The decomposition uses pre-discount food cost — actual food paid (final_price sum)
would be lower. This shows where the list-price money goes, not the discounted amount.
⚠️ Unaccounted amount may be negative for some orders if discounts reduce item totals
below the captured order_total — treat it as a reconciliation residual, not real spend.
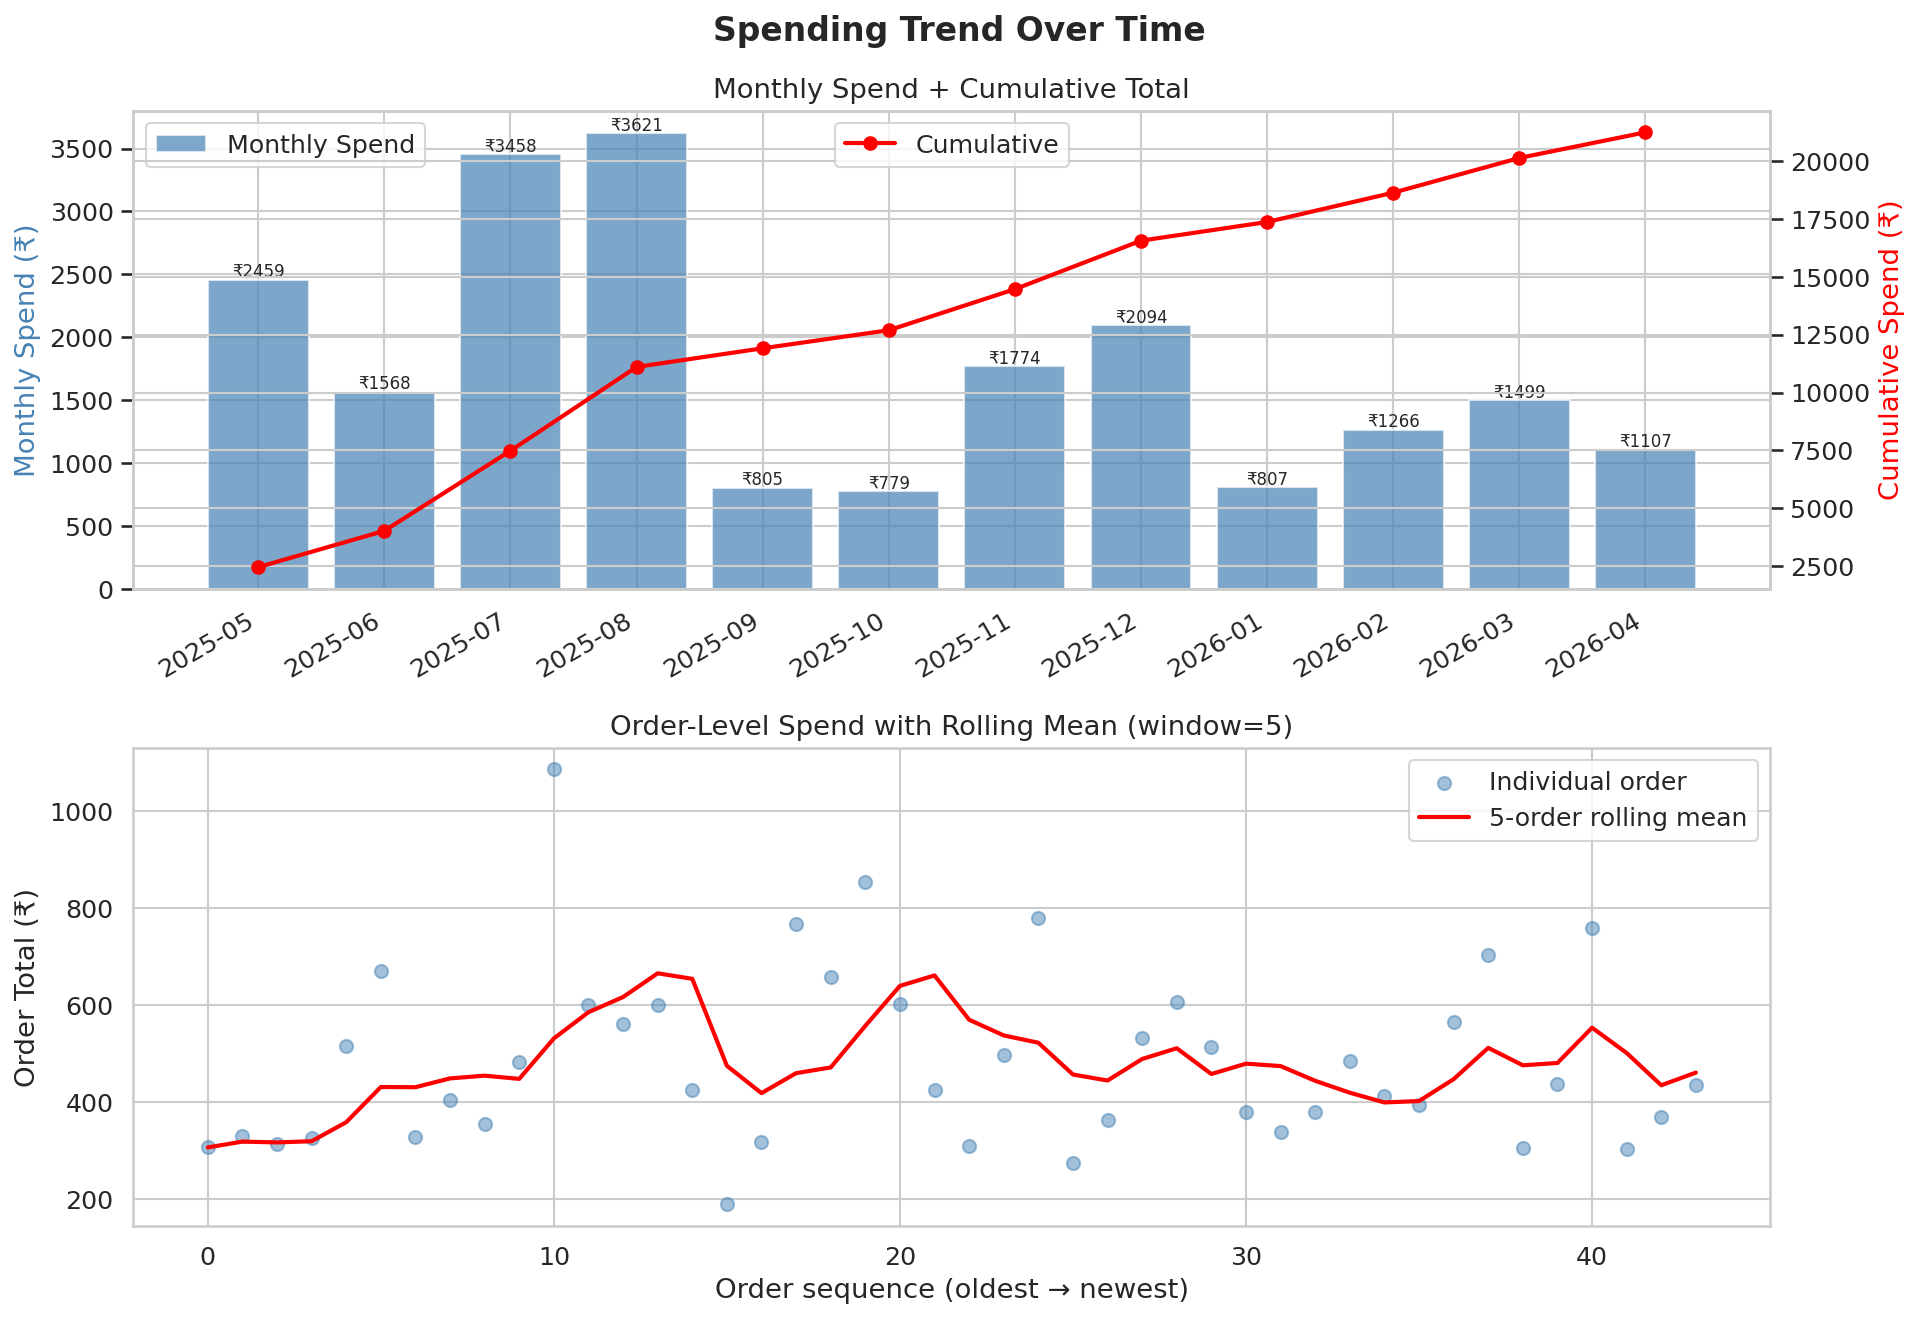
7. Spending Trend Over Time
| Month | Total Spend (₹) | Orders | Avg Order (₹) | Cumulative (₹) |
|---|---|---|---|---|
| 2025-05 | 2459.0 | 6 | 409.83 | 2459.0 |
| 2025-06 | 1568.0 | 4 | 392.0 | 4027.0 |
| 2025-07 | 3458.0 | 6 | 576.33 | 7485.0 |
| 2025-08 | 3621.0 | 6 | 603.5 | 11106.0 |
| 2025-09 | 805.0 | 2 | 402.5 | 11911.0 |
| 2025-10 | 779.0 | 1 | 779.0 | 12690.0 |
| 2025-11 | 1774.0 | 4 | 443.5 | 14464.0 |
| 2025-12 | 2094.0 | 5 | 418.8 | 16558.0 |
| 2026-01 | 807.0 | 2 | 403.5 | 17365.0 |
| 2026-02 | 1266.0 | 2 | 633.0 | 18631.0 |
| 2026-03 | 1499.0 | 3 | 499.67 | 20130.0 |
| 2026-04 | 1107.0 | 3 | 369.0 | 21237.0 |
Observation: Monthly spend shows a downward trend from the first to the last month. 2025-05 had the most orders (6) and 2025-08 had the highest total spend (₹3621).
Interpretation: A downward trend may reflect growing home cooking, reduced disposable income, or the data simply capturing a wind-down period. Check whether order frequency or order size (avg order value) drove the drop.
⚠️ This dataset covers only the last ~45 orders accessible via the web API. The trend reflects a short window (12 months) and may not represent long-term behaviour. Interpret month-on-month changes with caution given low order counts per month (avg 3 orders/month).
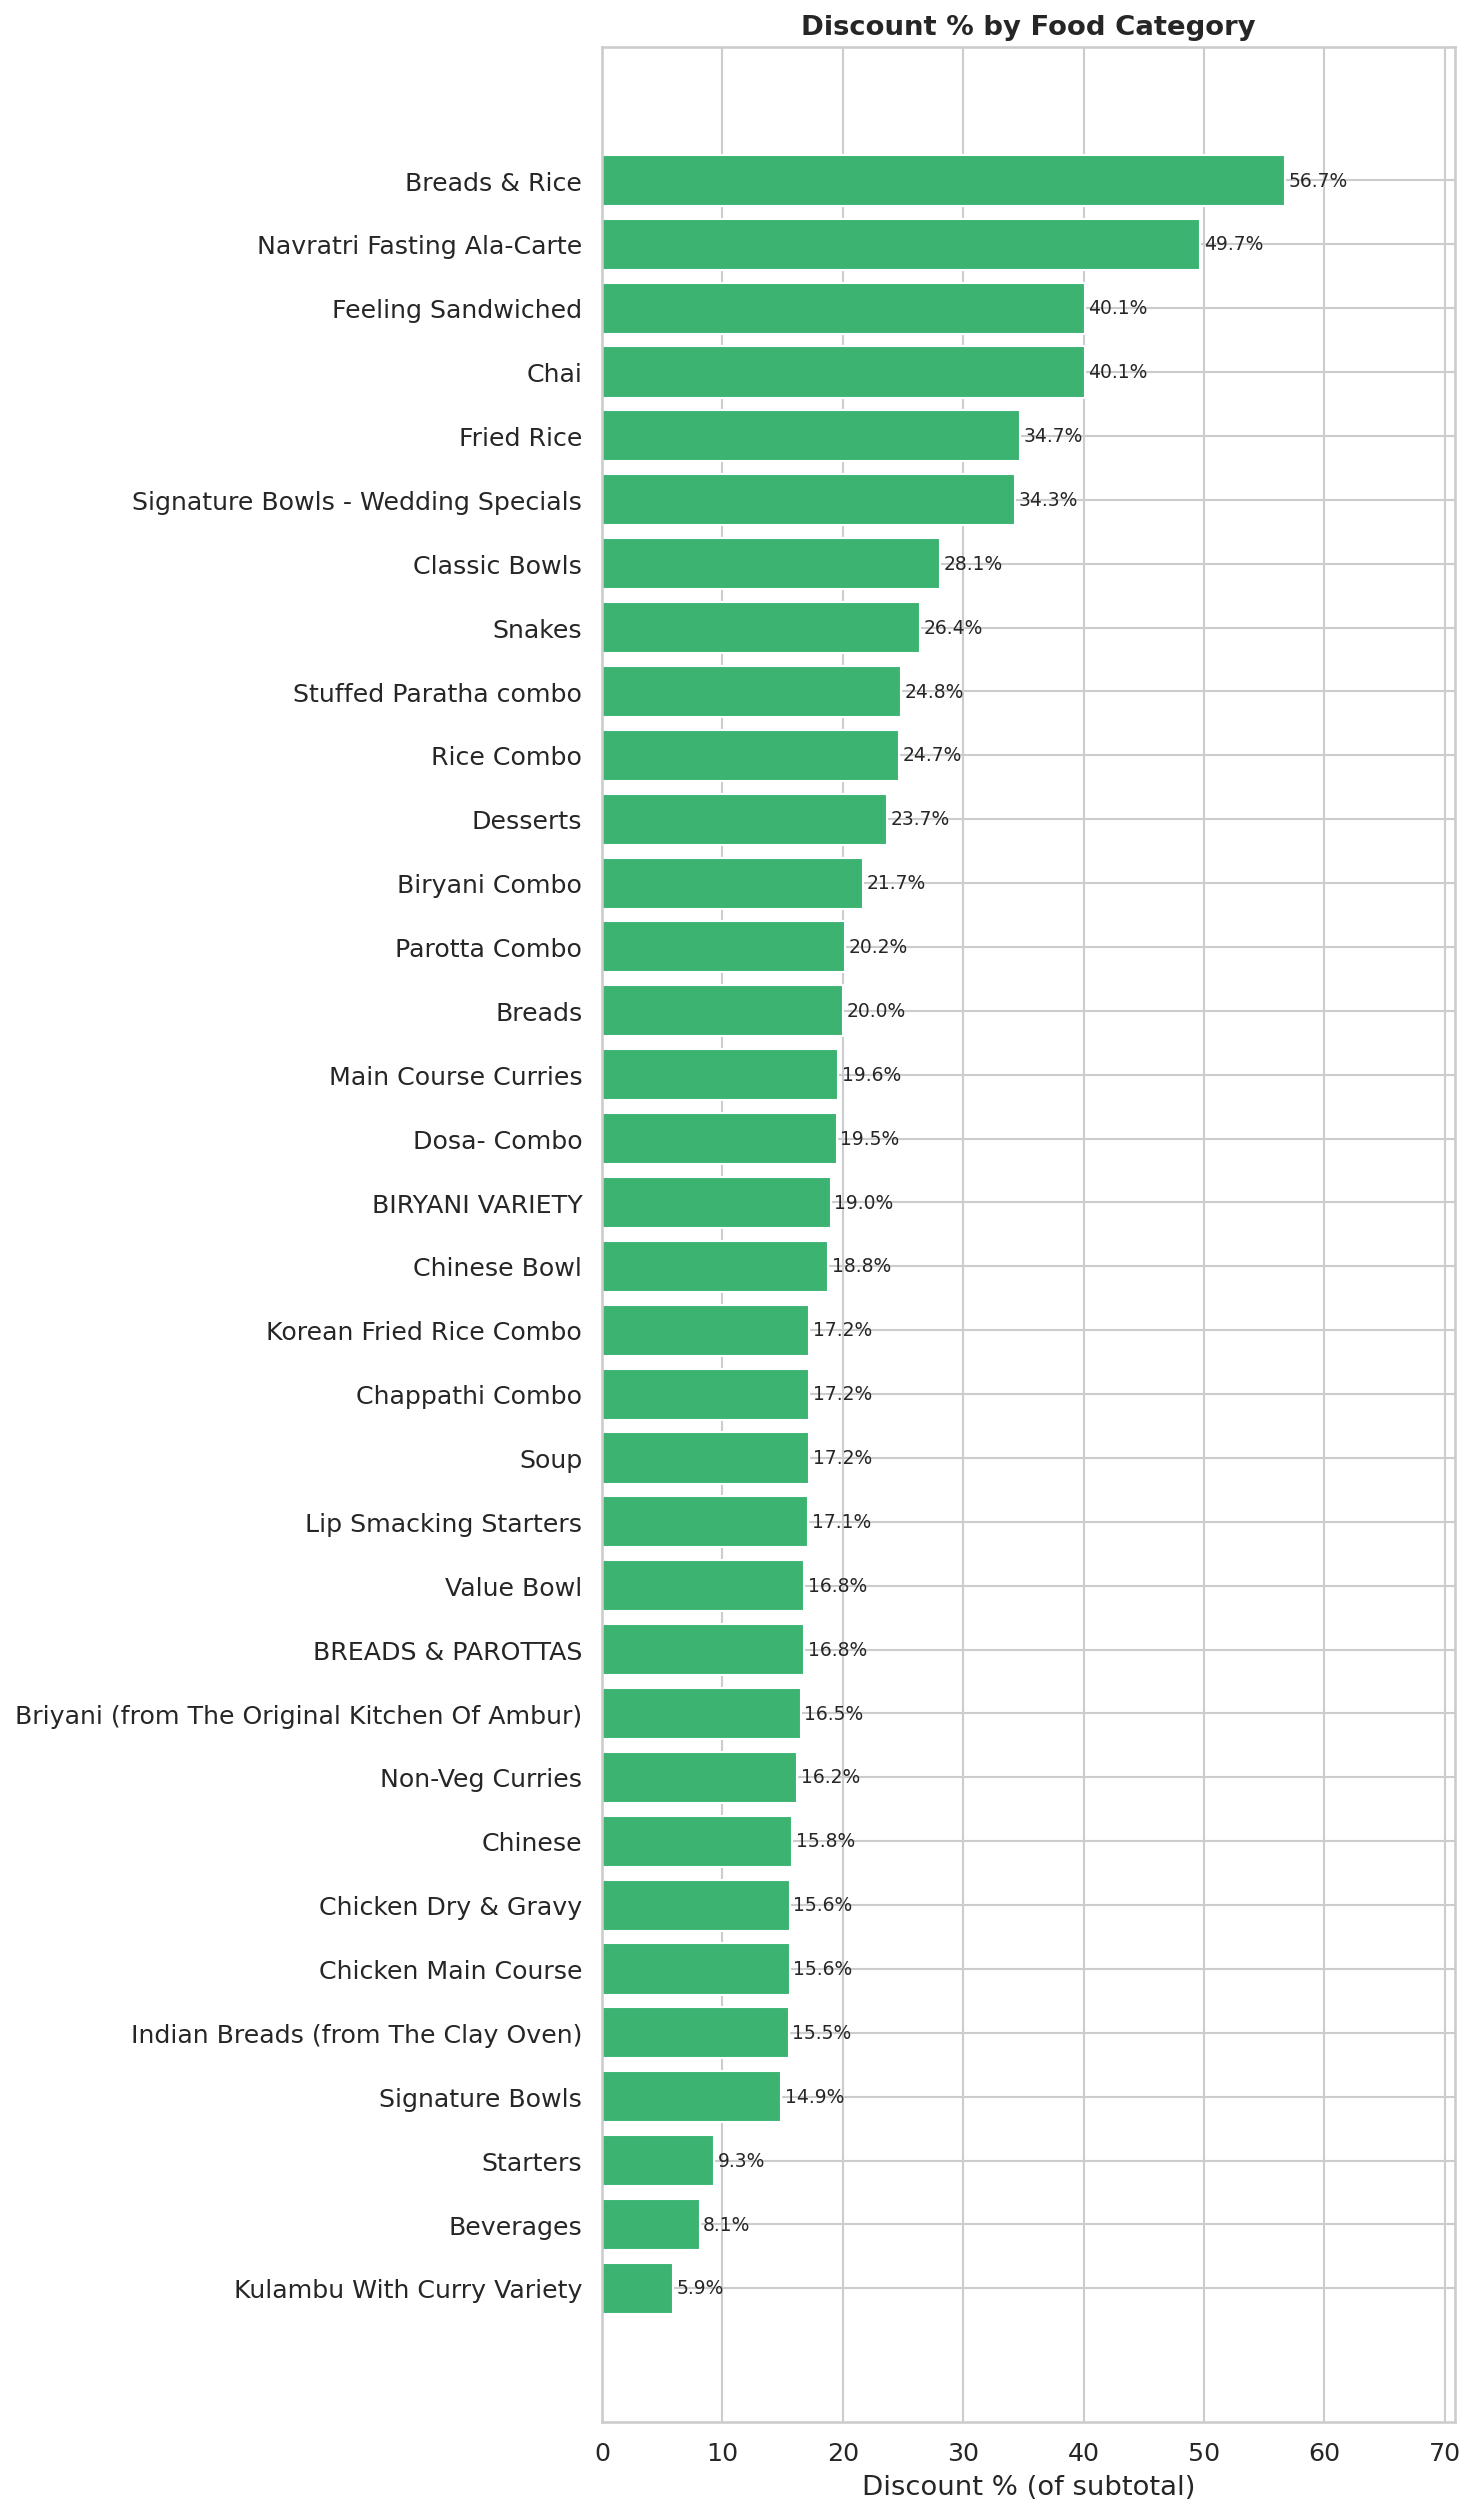
8. Discount Effectiveness by Category
| Category | Items Ordered | Avg Base Price (₹) | Avg Final Price (₹) | Discount % |
|---|---|---|---|---|
| Breads | 11 | 55.27 | 67.19 | 20.0 |
| Beverages | 5 | 131.62 | 120.9 | 8.1 |
| Starters | 5 | 81.2 | 73.62 | 9.3 |
| Legendary Andhra Meals | 5 | 297.0 | 297.0 | 0.0 |
| Kulambu With Curry Variety | 4 | 92.25 | 86.85 | 5.9 |
| Main Course Curries | 4 | 182.5 | 146.66 | 19.6 |
| Special's | 3 | 163.33 | 163.33 | 0.0 |
| Dosa- Combo | 3 | 229.0 | 184.31 | 19.5 |
| Chinese Bowl | 3 | 300.0 | 243.46 | 18.8 |
| Parotta Combo | 3 | 229.0 | 182.84 | 20.2 |
| Classic Bowls | 3 | 209.0 | 150.17 | 28.1 |
| Lip Smacking Starters | 3 | 311.67 | 258.33 | 17.1 |
| Signature Bowls | 2 | 408.0 | 347.39 | 14.9 |
| BREADS & PAROTTAS | 2 | 54.5 | 65.69 | 16.8 |
| Biryani Combo | 2 | 199.0 | 155.91 | 21.7 |
| BIRYANI VARIETY | 2 | 417.0 | 337.76 | 19.0 |
| Chappathi Combo | 2 | 199.0 | 164.84 | 17.2 |
| Desserts | 2 | 99.0 | 75.52 | 23.7 |
| Savorie 250 Gms | 2 | 145.0 | 145.0 | 0.0 |
| Briyani (from The Original Kitchen Of Ambur) | 2 | 424.5 | 354.5 | 16.5 |
| Chettinad Varieties | 2 | 115.0 | 115.0 | 0.0 |
| Rice Bowls | 2 | 287.0 | 287.0 | 0.0 |
| Main Course | 2 | 215.0 | 215.0 | 0.0 |
| Signature Bowls - Wedding Specials | 1 | 408.0 | 268.0 | 34.3 |
| Rice Combo | 1 | 139.0 | 104.6 | 24.7 |
| Navratri Fasting Ala-Carte | 1 | 197.0 | 99.0 | 49.7 |
| Chai | 1 | 148.0 | 88.63 | 40.1 |
| Breads & Rice | 1 | 97.0 | 84.0 | 56.7 |
| Snakes | 1 | 121.0 | 89.0 | 26.4 |
| Fried Rice | 1 | 290.0 | 189.31 | 34.7 |
| Feeling Sandwiched | 1 | 176.0 | 105.38 | 40.1 |
| Stuffed Paratha combo | 1 | 164.0 | 123.41 | 24.8 |
| Non-Veg Curries | 1 | 297.0 | 249.0 | 16.2 |
| Chinese | 1 | 290.0 | 244.06 | 15.8 |
| Soup | 1 | 165.0 | 136.62 | 17.2 |
| Chaat Varieties | 1 | 125.0 | 125.0 | 0.0 |
| Chicken Main Course | 1 | 400.0 | 337.5 | 15.6 |
| Chicken Dry & Gravy | 1 | 400.0 | 337.5 | 15.6 |
| Indian Breads (from The Clay Oven) | 1 | 95.0 | 80.25 | 15.5 |
| Korean Fried Rice Combo | 1 | 279.0 | 231.11 | 17.2 |
| Value Bowl | 1 | 249.0 | 207.05 | 16.8 |
| Chicken Biryani | 1 | 319.0 | 319.0 | 0.0 |
| DOSA | 1 | 160.0 | 160.0 | 0.0 |
| Fruit Juices | 1 | 263.25 | 263.25 | 0.0 |
| Flavour Fun Range | 1 | 278.0 | 278.0 | 0.0 |
| Evening Specials | 1 | 105.0 | 105.0 | 0.0 |
| Faloodas | 1 | 270.0 | 270.0 | 0.0 |
| Chicken Boneless Biryani | 1 | 379.0 | 379.0 | 0.0 |
| IDLI | 1 | 180.0 | 180.0 | 0.0 |
| Noodles | 1 | 290.0 | 290.0 | 0.0 |
| Sandwiches | 1 | 195.75 | 195.75 | 0.0 |
Observation: 'Breads & Rice' receives the highest discount at 56.7% off subtotal. 17 categories — Chaat Varieties, DOSA, Chicken Biryani, Chicken Boneless Biryani, Chettinad Varieties... — are never discounted.
Interpretation: Categories with consistent discounts are where Swiggy promotions are targeted — often staples or high-competition items (rice bowls, biryani). Categories with zero discounts are either low-volume items with no active offers or premium items restaurants protect from discounting. If your most-ordered categories are never discounted, you're paying full menu price every time — worth checking competitor restaurants for the same dish at lower price.
⚠️ Discount % is calculated as item_total_discount / subtotal at item level. Categories with only 1–2 items ordered may show extreme values (100% or 0%) that are not representative — check the "Items Ordered" column before drawing conclusions.
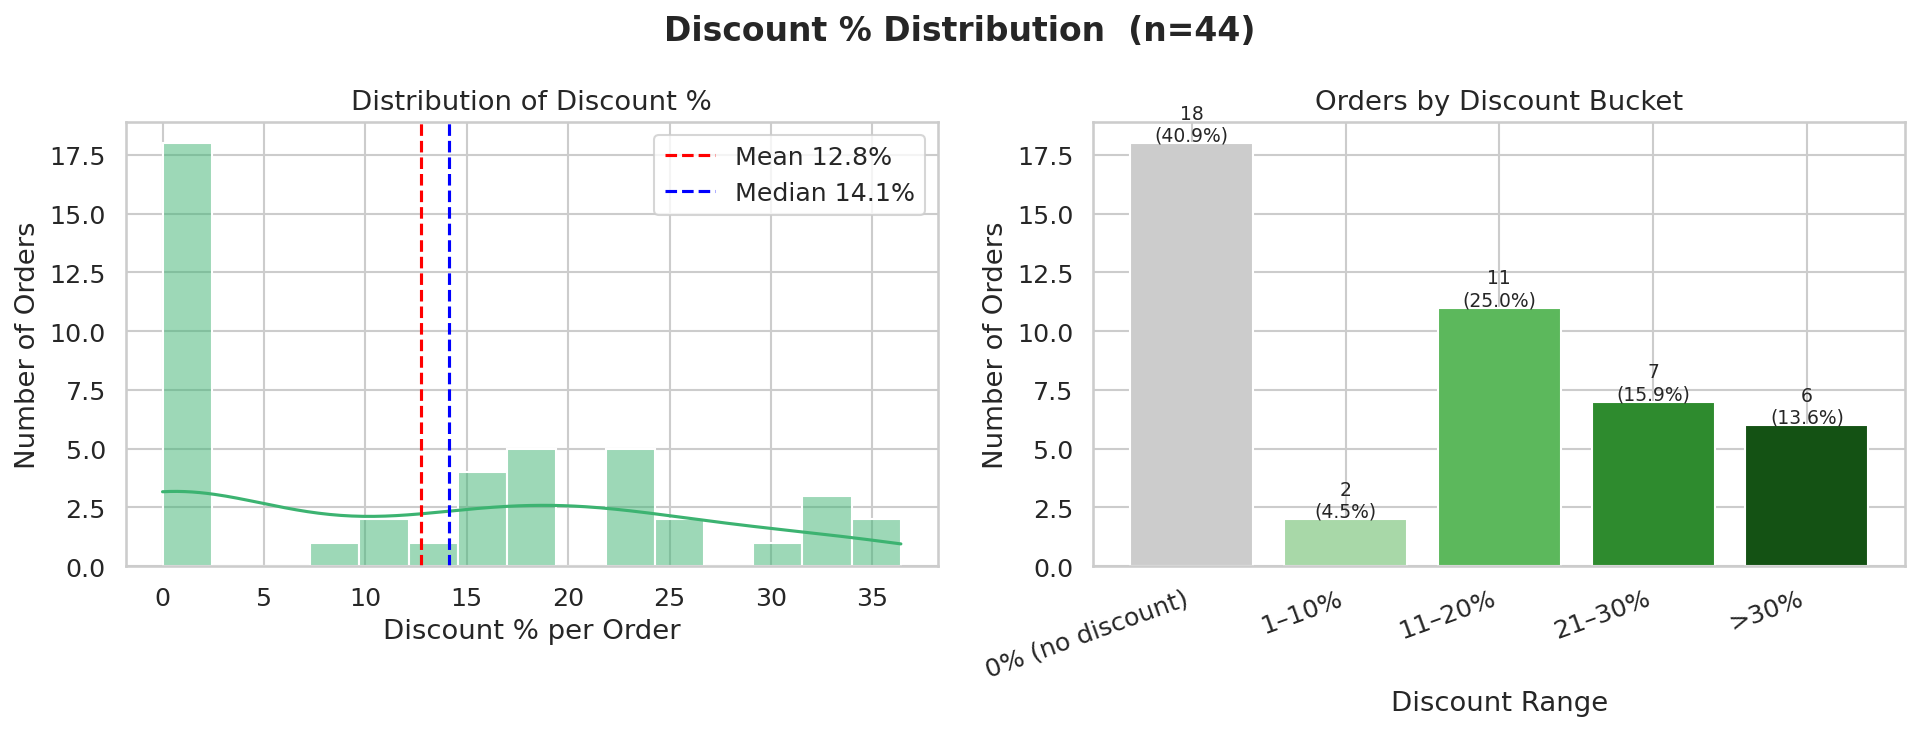
9. Discount Percentage Distribution
| Discount Range | Orders | % of Orders |
|---|---|---|
| 0% (no discount) | 18 | 40.9 |
| 1–10% | 2 | 4.5 |
| 11–20% | 11 | 25.0 |
| 21–30% | 7 | 15.9 |
| >30% | 6 | 13.6 |
Observation: 18 of 44 orders (41%) had zero discount. Only 6 orders had discounts exceeding 30%. Mean discount rate is 12.8% and median is 14.1%.
Interpretation: Discounts are common but mostly shallow — the bulk of orders fall in the 1–20% range rather than deep discount territory. Swiggy offers are reducing bills incrementally, not dramatically. The gap between mean and median indicates a few orders with very large discounts skew the average upward.
⚠️ Orders with 0% discount may still have received order-level coupon discounts
not captured in item_total_discount. Zero here means no item-level offer was applied.
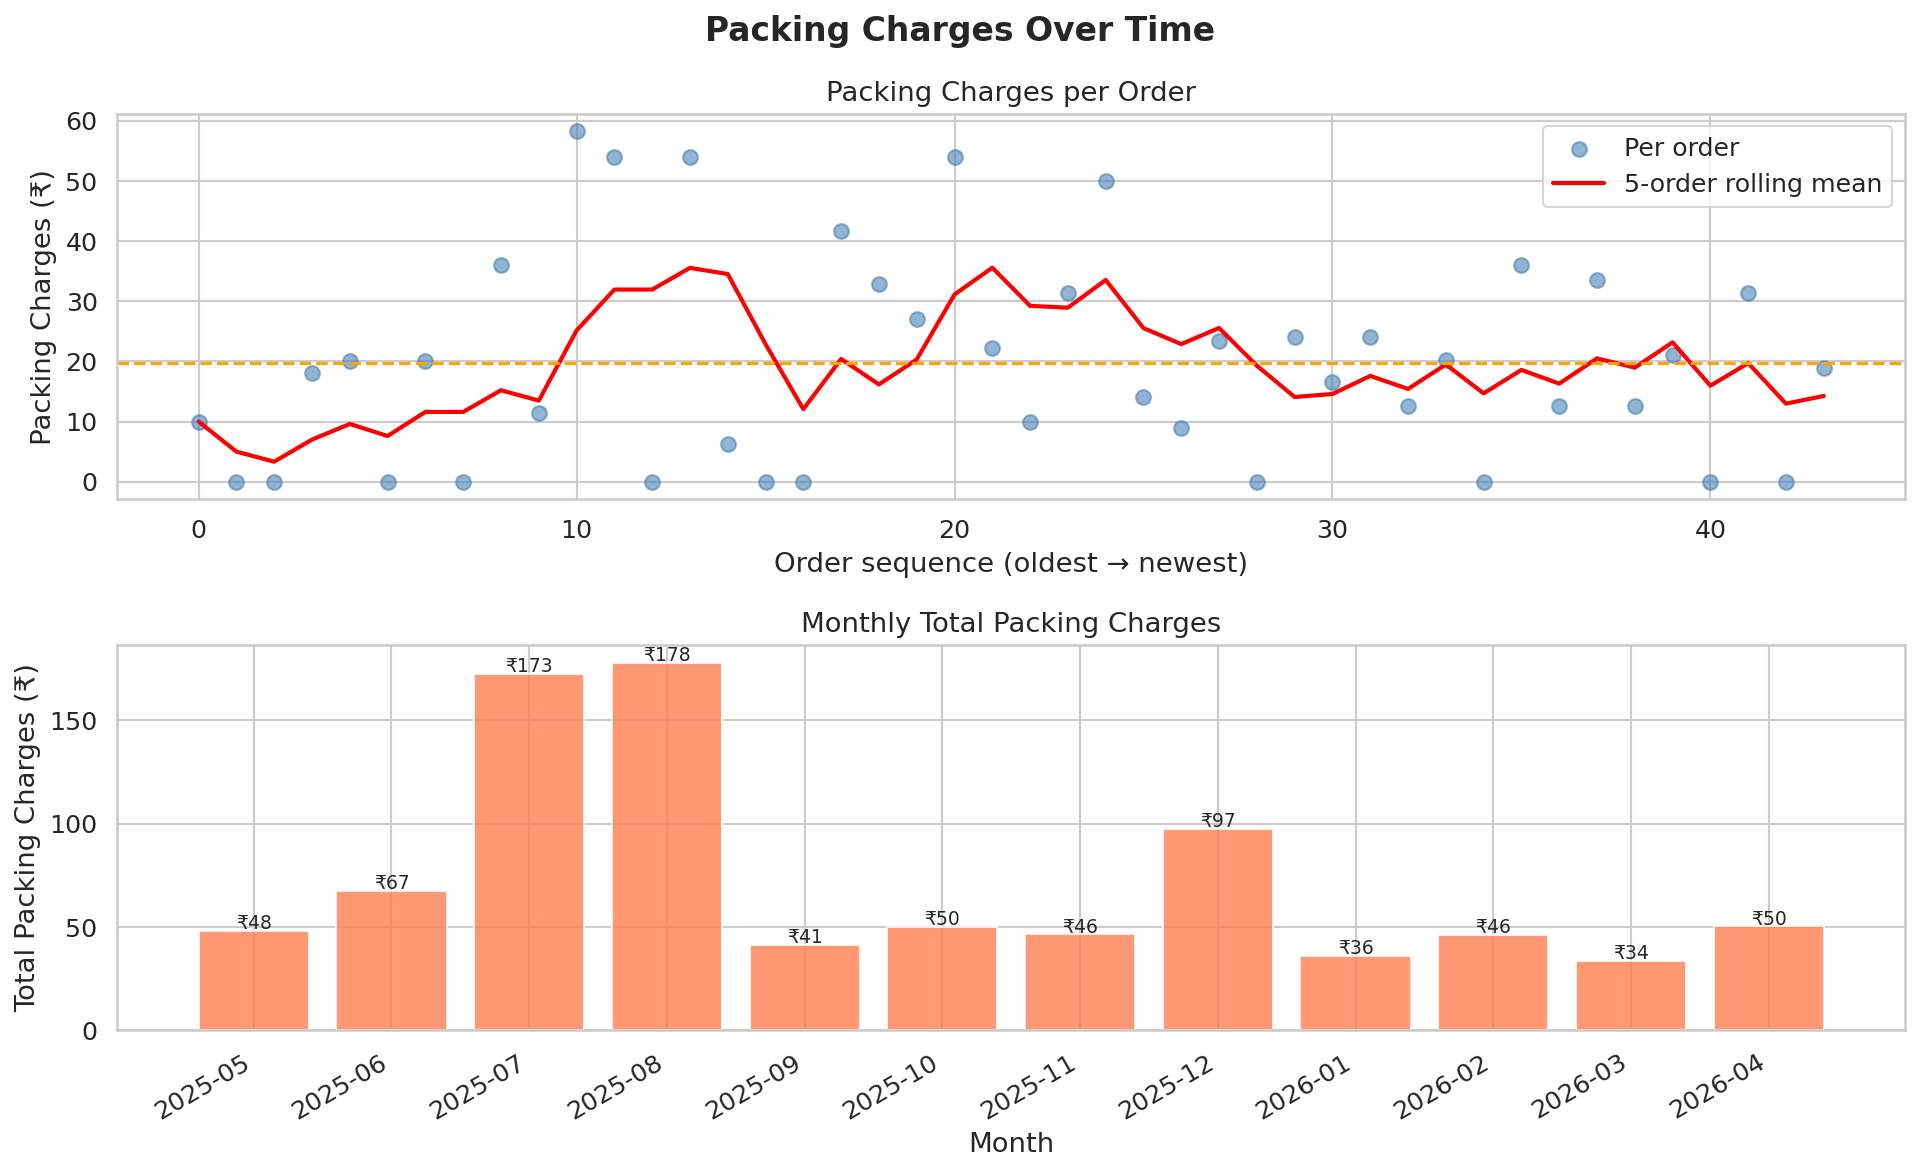
10. Packing Charges Over Time
| Month | Avg Packing/Order (₹) | Total Packing (₹) |
|---|---|---|
| 2025-05 | 8.0 | 48.0 |
| 2025-06 | 16.85 | 67.4 |
| 2025-07 | 28.76 | 172.55 |
| 2025-08 | 29.64 | 177.81 |
| 2025-09 | 20.67 | 41.35 |
| 2025-10 | 50.0 | 50.0 |
| 2025-11 | 11.6 | 46.4 |
| 2025-12 | 19.48 | 97.4 |
| 2026-01 | 18.0 | 36.0 |
| 2026-02 | 23.1 | 46.2 |
| 2026-03 | 11.2 | 33.6 |
| 2026-04 | 16.75 | 50.25 |
Observation: Average packing charge is ₹19.70 per order (median ₹18.48). Total paid in packing across all orders: ₹866.96. 11 orders had zero packing charges.
Interpretation: Packing charges are consistently present and quietly add up — ₹867 paid purely for packaging is a non-trivial hidden cost over 44 orders. Restaurants that charge zero packing are comparatively cheaper for the same food price. Month-on-month variation shows whether ordering habits have shifted toward higher-packing-fee restaurants over time.
⚠️ Packing charges vary by restaurant, not by Swiggy — some restaurants charge per item, others a flat fee. This metric reflects restaurant choice as much as frequency of ordering.
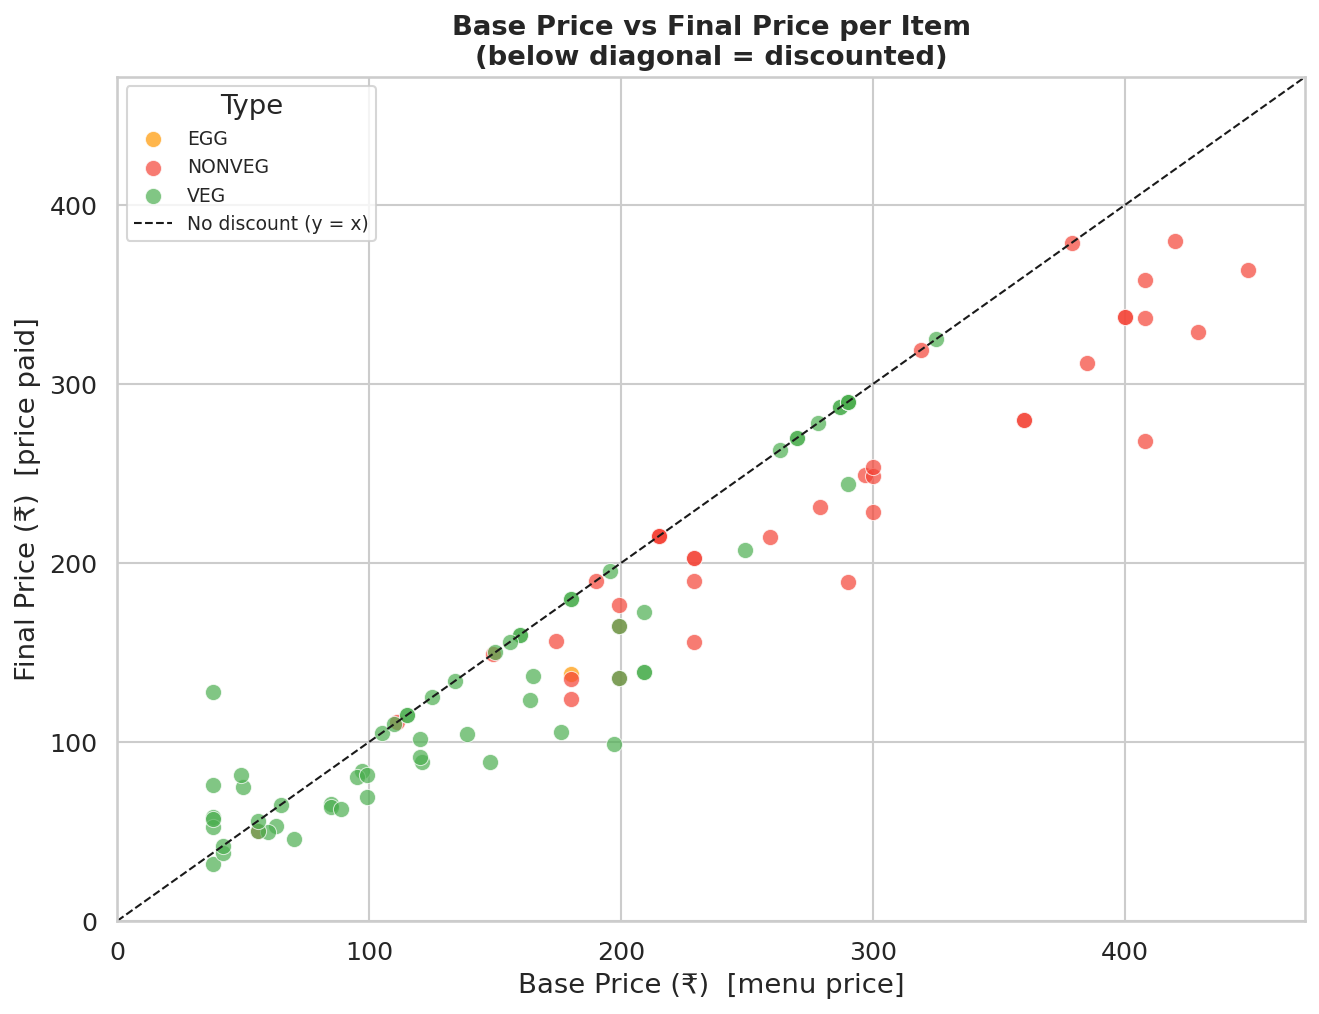
11. Base Price vs Final Price (Scatter)
Observation: 37 of 102 items sit on the diagonal (no discount). 65 items fall below — meaning a discount was applied. The largest single-item discount was ₹140.00 on 'Mughlai Grilled Chicken Rice Bowl with Omelette' (₹408 → ₹268).
Interpretation: Items tightly clustered along the diagonal are full-price purchases — no active offer was running at order time. Items well below the diagonal represent genuine savings. A wide spread below the line indicates Swiggy promotions are inconsistently applied — some order sessions are much better value than others.
⚠️ Each dot is one item row, not one order. An order with 3 items contributes 3 dots. High-priced items (top-right cluster) with no discount represent the biggest missed savings opportunities — worth checking if those restaurants offer deals at different times.
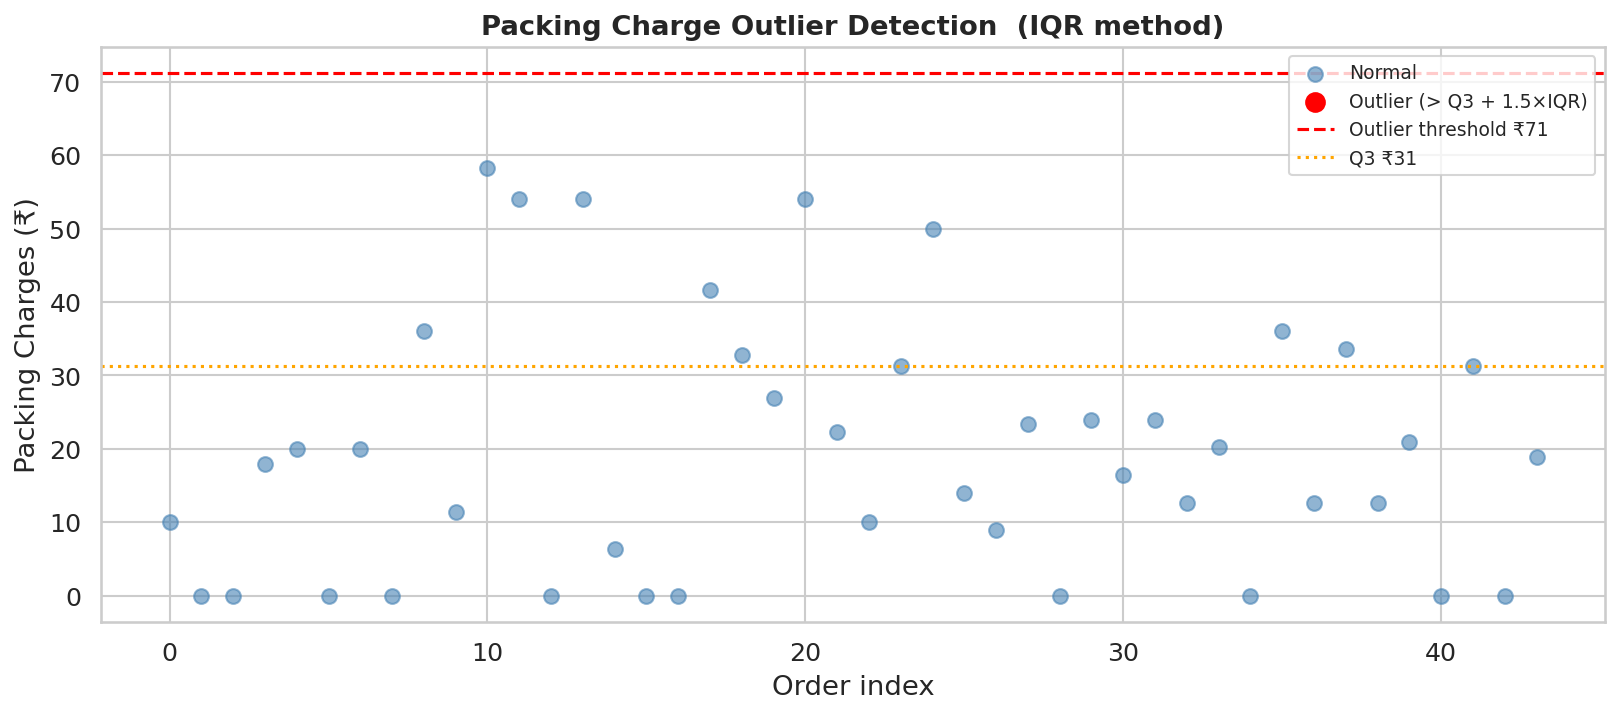
12. Orders with Unusually High Packing Charges
IQR method: Q1=₹4.72, Q3=₹31.31, IQR=₹26.59, Outlier threshold = Q3 + 1.5×IQR = ₹71.19
0 order(s) flagged as outliers:
No outliers detected.
Observation: 0 order(s) exceed the IQR outlier threshold of ₹71.19 for packing charges. Packing charges are consistent across all orders — no restaurant stands out as an outlier.
Interpretation: High packing charges relative to order value are a quiet tax on delivery orders. A restaurant charging ₹50–80 in packing on a ₹200 order is effectively adding 25–40% to the menu price. These outliers are worth factoring into future restaurant choices.
⚠️ IQR-based outlier detection works best on symmetric distributions. If packing charges are right-skewed (many zeros, few high values), the threshold may flag too few or too many orders. Always cross-reference with the "Packing % of Total" column for context.
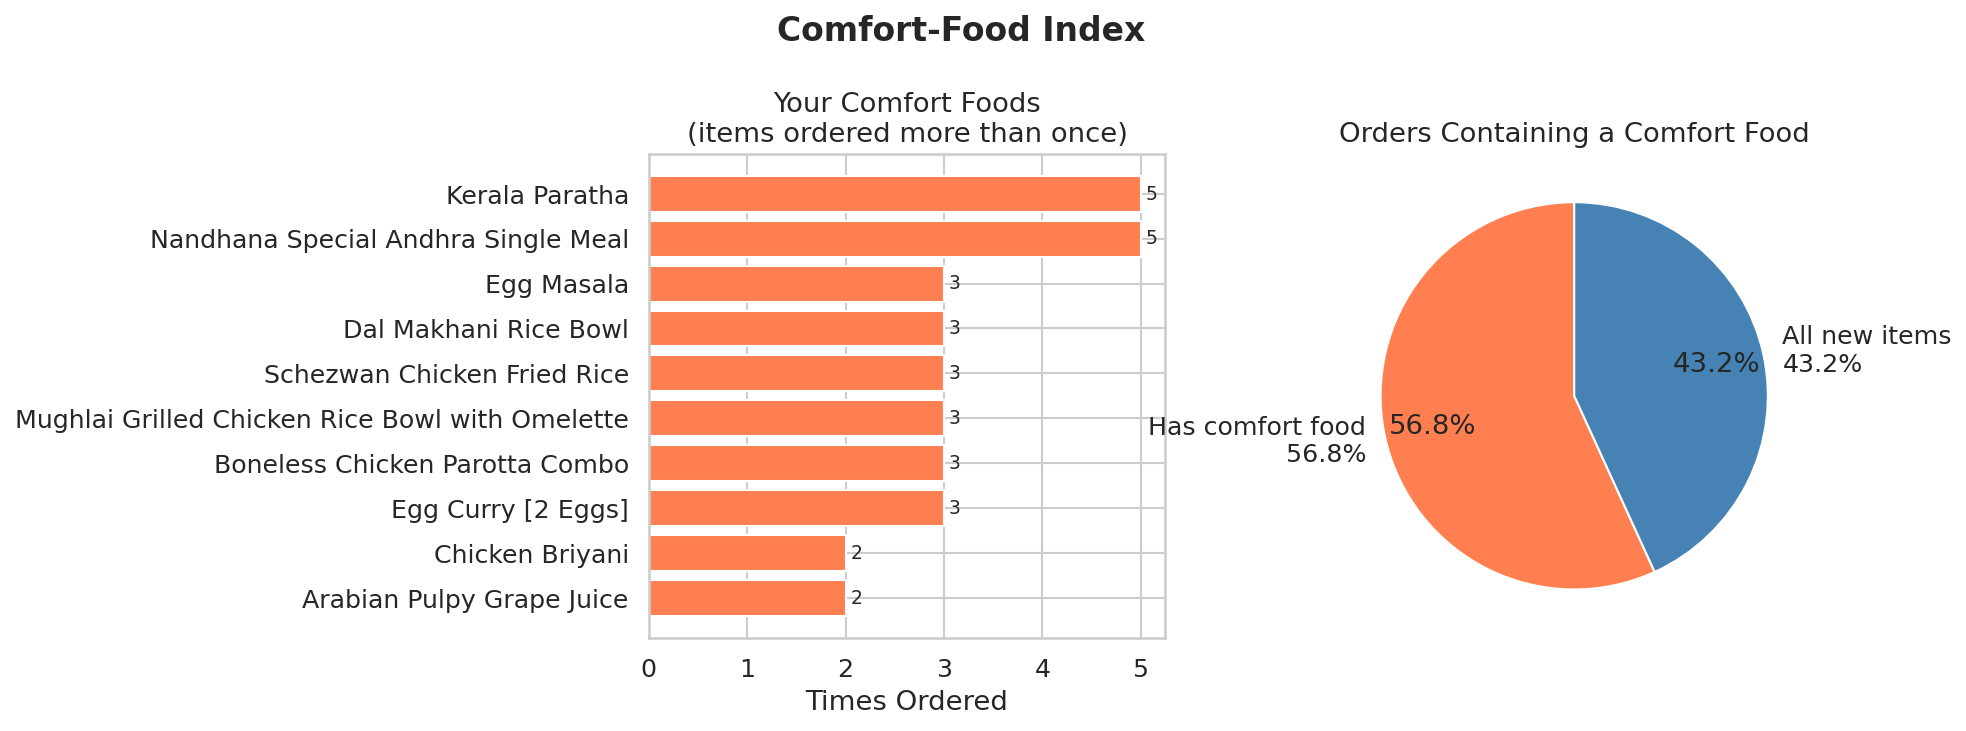
13. Comfort-Food Index
Comfort foods (items ordered more than once):
| Item | Times Ordered | Total Spend (₹) |
|---|---|---|
| Kerala Paratha | 5 | 371.41 |
| Nandhana Special Andhra Single Meal | 5 | 1485.0 |
| Boneless Chicken Parotta Combo | 3 | 548.51 |
| Egg Curry [2 Eggs] | 3 | 396.64 |
| Egg Masala | 3 | 620.0 |
| Dal Makhani Rice Bowl | 3 | 450.52 |
| Mughlai Grilled Chicken Rice Bowl with Omelette | 3 | 962.78 |
| Schezwan Chicken Fried Rice | 3 | 730.37 |
| Chicken Briyani | 2 | 709.0 |
| Arabian Pulpy Grape Juice | 2 | 192.79 |
| Garlic Naan | 2 | 128.87 |
| Egg Biryani Combo | 2 | 311.82 |
| Rasam | 2 | 79.8 |
| Rose Falooda | 2 | 540.0 |
| Metric | Value |
|---|---|
| Unique comfort-food items | 14 |
| Orders containing ≥1 comfort food | 25 of 44 (56.8%) |
| Spend on comfort foods | ₹7527.51 (42.4% of total food spend) |
Observation: 14 items were ordered more than once, appearing in 25 of 44 orders (56.8%). Comfort foods account for 42.4% of total food spend (₹7527.51).
Interpretation: A high comfort-food index (57%) means ordering behaviour is habit-driven — you return to the same dishes repeatedly. This is normal and not inherently bad, but it does mean you may be missing out on variety and potentially better value elsewhere. The items that appear multiple times are your true staples — the dishes Swiggy delivery reliably delivers for you.
⚠️ "Times ordered" counts distinct orders, not total quantity. If the same item appears twice in one order, it still counts as 1 here. An item ordered once is not necessarily disliked — it may simply be a one-off exploration.