Watching My ACT Internet Watch Itself: Uptime Kuma + Cloudflare Tunnel
How I built a tiny status page that tells me — and anyone who asks — whether my home internet is behaving. No public IP. No port forwarding. No router gymnastics.
The problem
My ISP has opinions. Some evenings it delivers a crisp gigabit, other evenings it behaves like a damp sponge. And whenever I complain, the conversation goes like this:
“Sir, is the internet currently down?” “No, it’s up right now.” “Then there is no issue, sir.”
The outage is always yesterday. Support tickets need evidence, and the only evidence I had was my own increasingly frustrated memory. That’s a bad witness.
What I really wanted was a little dashboard sitting somewhere, quietly poking the internet every thirty seconds, drawing graphs I could screenshot and send. Bonus points if the rest of the household — and, honestly, the support agent — could just visit a URL and see the same thing I see.
Two sub-problems fell out of that:
Something has to do the monitoring. It has to ping public hosts, log the results, and show me a timeline I can actually read.
That something has to be reachable from outside my house. Without opening ports on my router, without a static public IP (I don’t have one), and without exposing my whole home network to the world.
The answers turned out to be Uptime Kuma for problem one, and Cloudflare Tunnel for problem two. Both are free, both are boringly reliable, and together they took a single evening to wire up.
Let’s walk through it.
Getting it running
Assuming Docker is already installed, the entire install is a single docker run. That’s it. No compose file, no reverse proxy yet, nothing fancy:
A quick tour of the flags, because understanding them pays dividends later:
druns it detached, in the background.-restart=alwaysmeans it comes back by itself after a reboot or crash. Set it once, forget it.p 3001:3001publishes the container’s port 3001 on the host.v uptime-kuma:/app/datastores the SQLite database and all your monitor history in a named Docker volume. If you skip this flag, your data dies with the container. Don’t skip it.louislam/uptime-kuma:1pins to the v1 major, which gives you patch updates but no surprise breaking changes.
Open http://localhost:3001 in a browser, and the first screen will ask you to create an admin account. Pick a username, pick a password, done. You’re in.
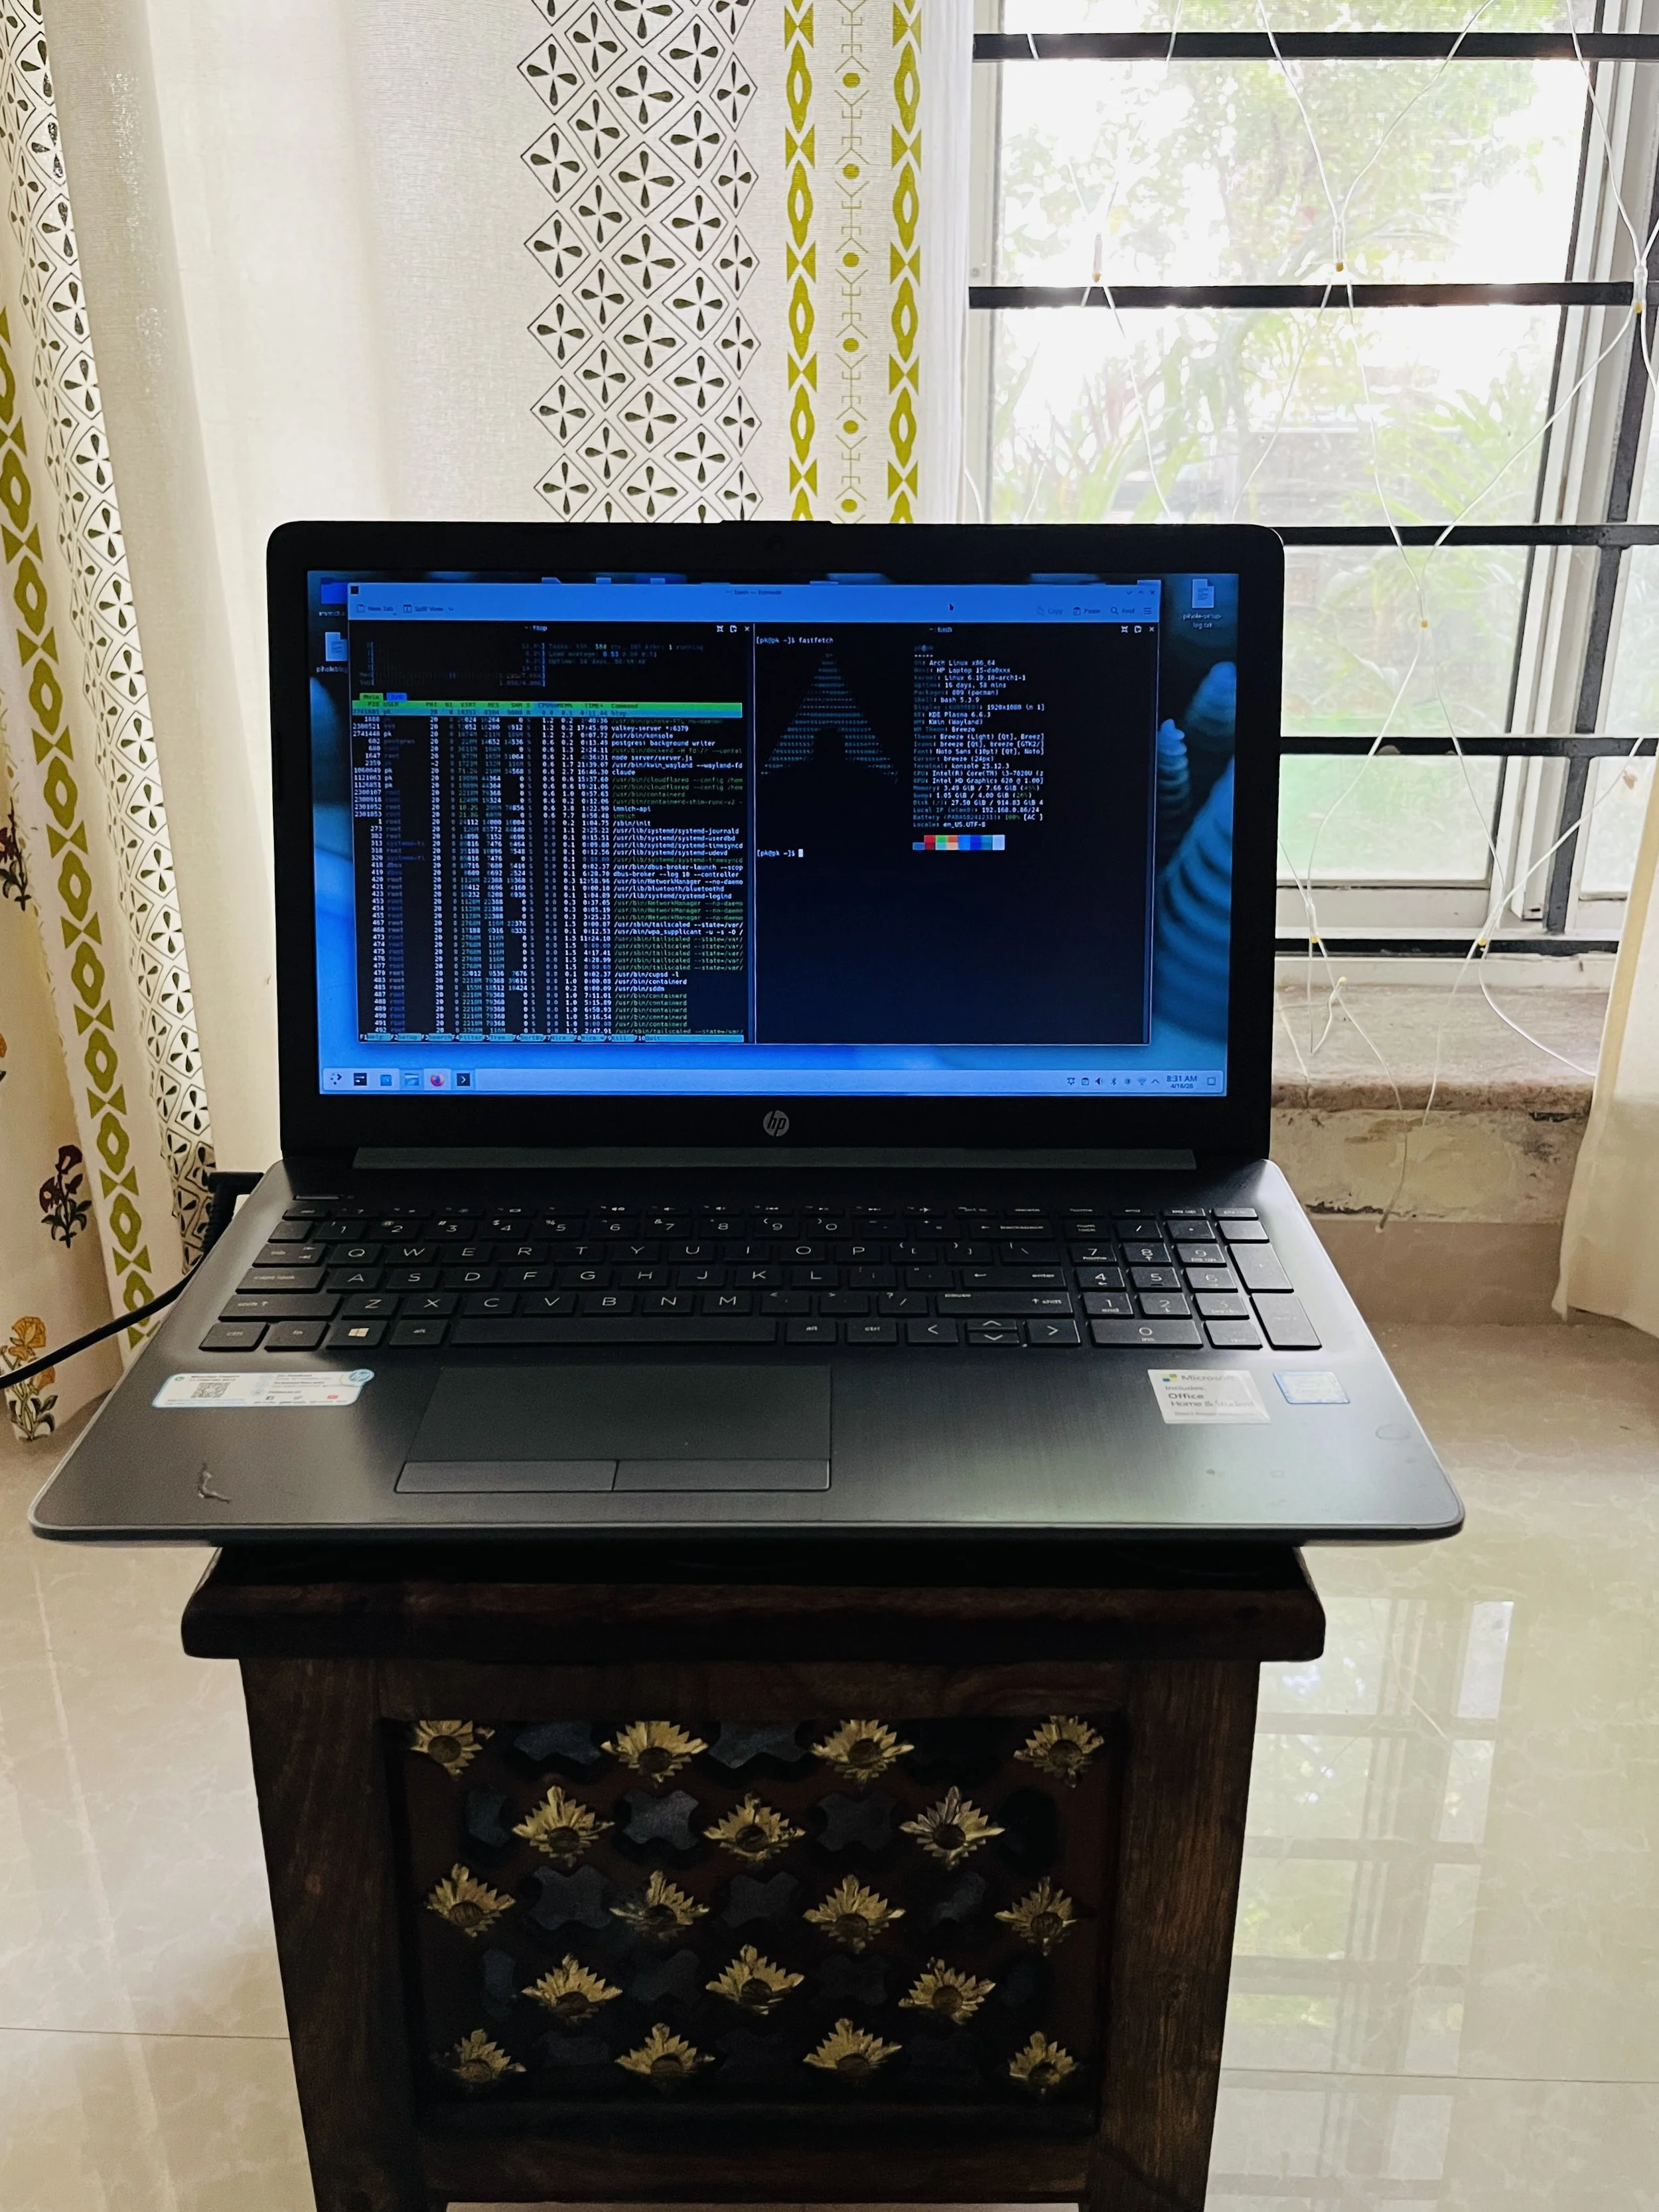
Old laptop now working as a 24/7 Server. ACT internet monitoring runs on this system(Arch Linux)
Teaching it what to watch
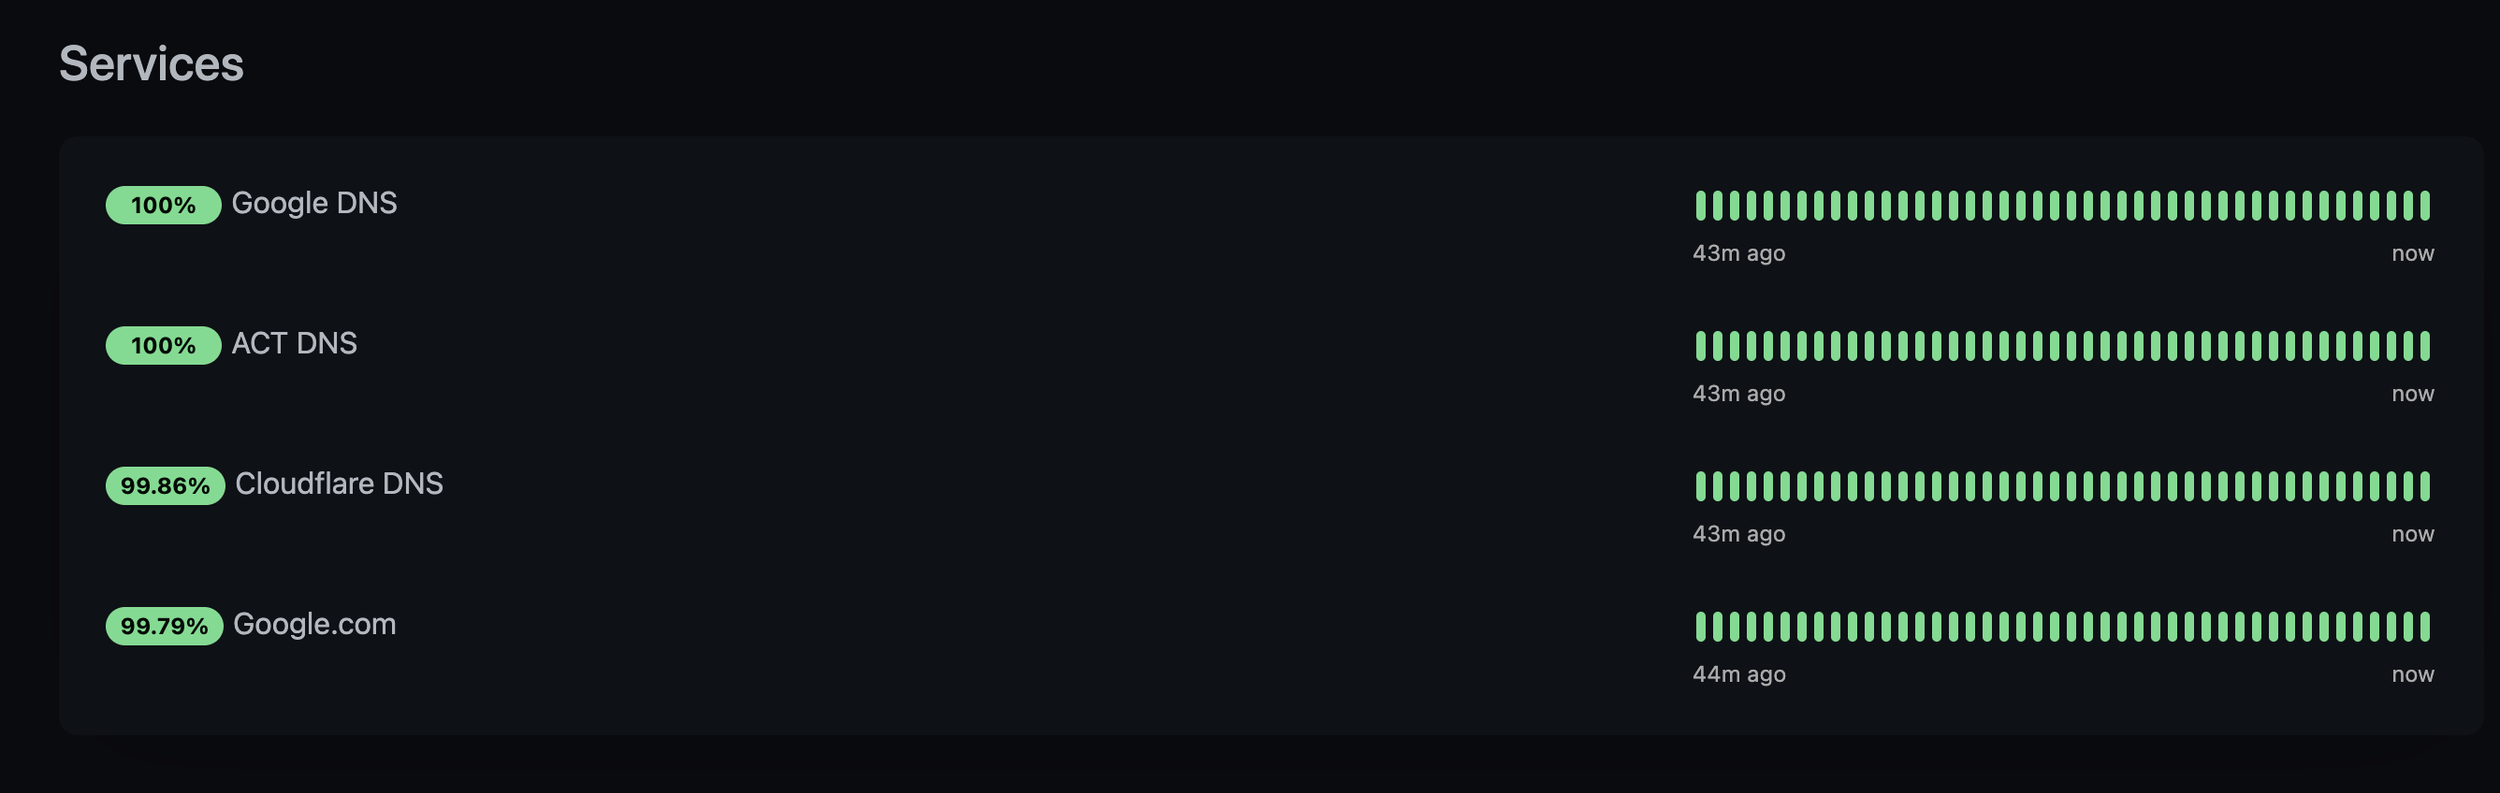
Here’s the fun part. You’ve got a blank dashboard and a big green + Add New Monitor button. I wanted to answer one question: is my internet actually working right now, and if not, whose fault is it?
So I added four monitors, all running every 30 seconds:
  +---+------+----------------+------------------------+-----------------------------------------------------------------------+
  | # | Type | Name           | Target                 | Why                                                                   |
  +---+------+----------------+------------------------+-----------------------------------------------------------------------+
  | 1 | Ping | Google DNS     | 8.8.8.8                | Baseline: can I reach the internet at all?                            |
  | 2 | Ping | Cloudflare DNS | 1.1.1.1                | Second opinion on the same question, different provider.             |
  | 3 | HTTP | Google Website | https://google.com     | Catches DNS-resolution and TLS issues that a raw ping would miss.     |
  | 4 | HTTP | ISP Website    | https://<your-isp>.com | If this goes down but Google stays up, the problem is likely my ISP.  |
  +---+------+----------------+------------------------+-----------------------------------------------------------------------+
That last one is the clever bit, and I can’t take credit for the idea — it’s the oldest trick in the sysadmin book. Always include a monitor that fails independently from the others. Two pings to two different DNS providers catch most outages, but when the ISP’s own infrastructure goes wobbly, their status page is often the first thing to stutter. It’s a tiny built-in lie-detector.
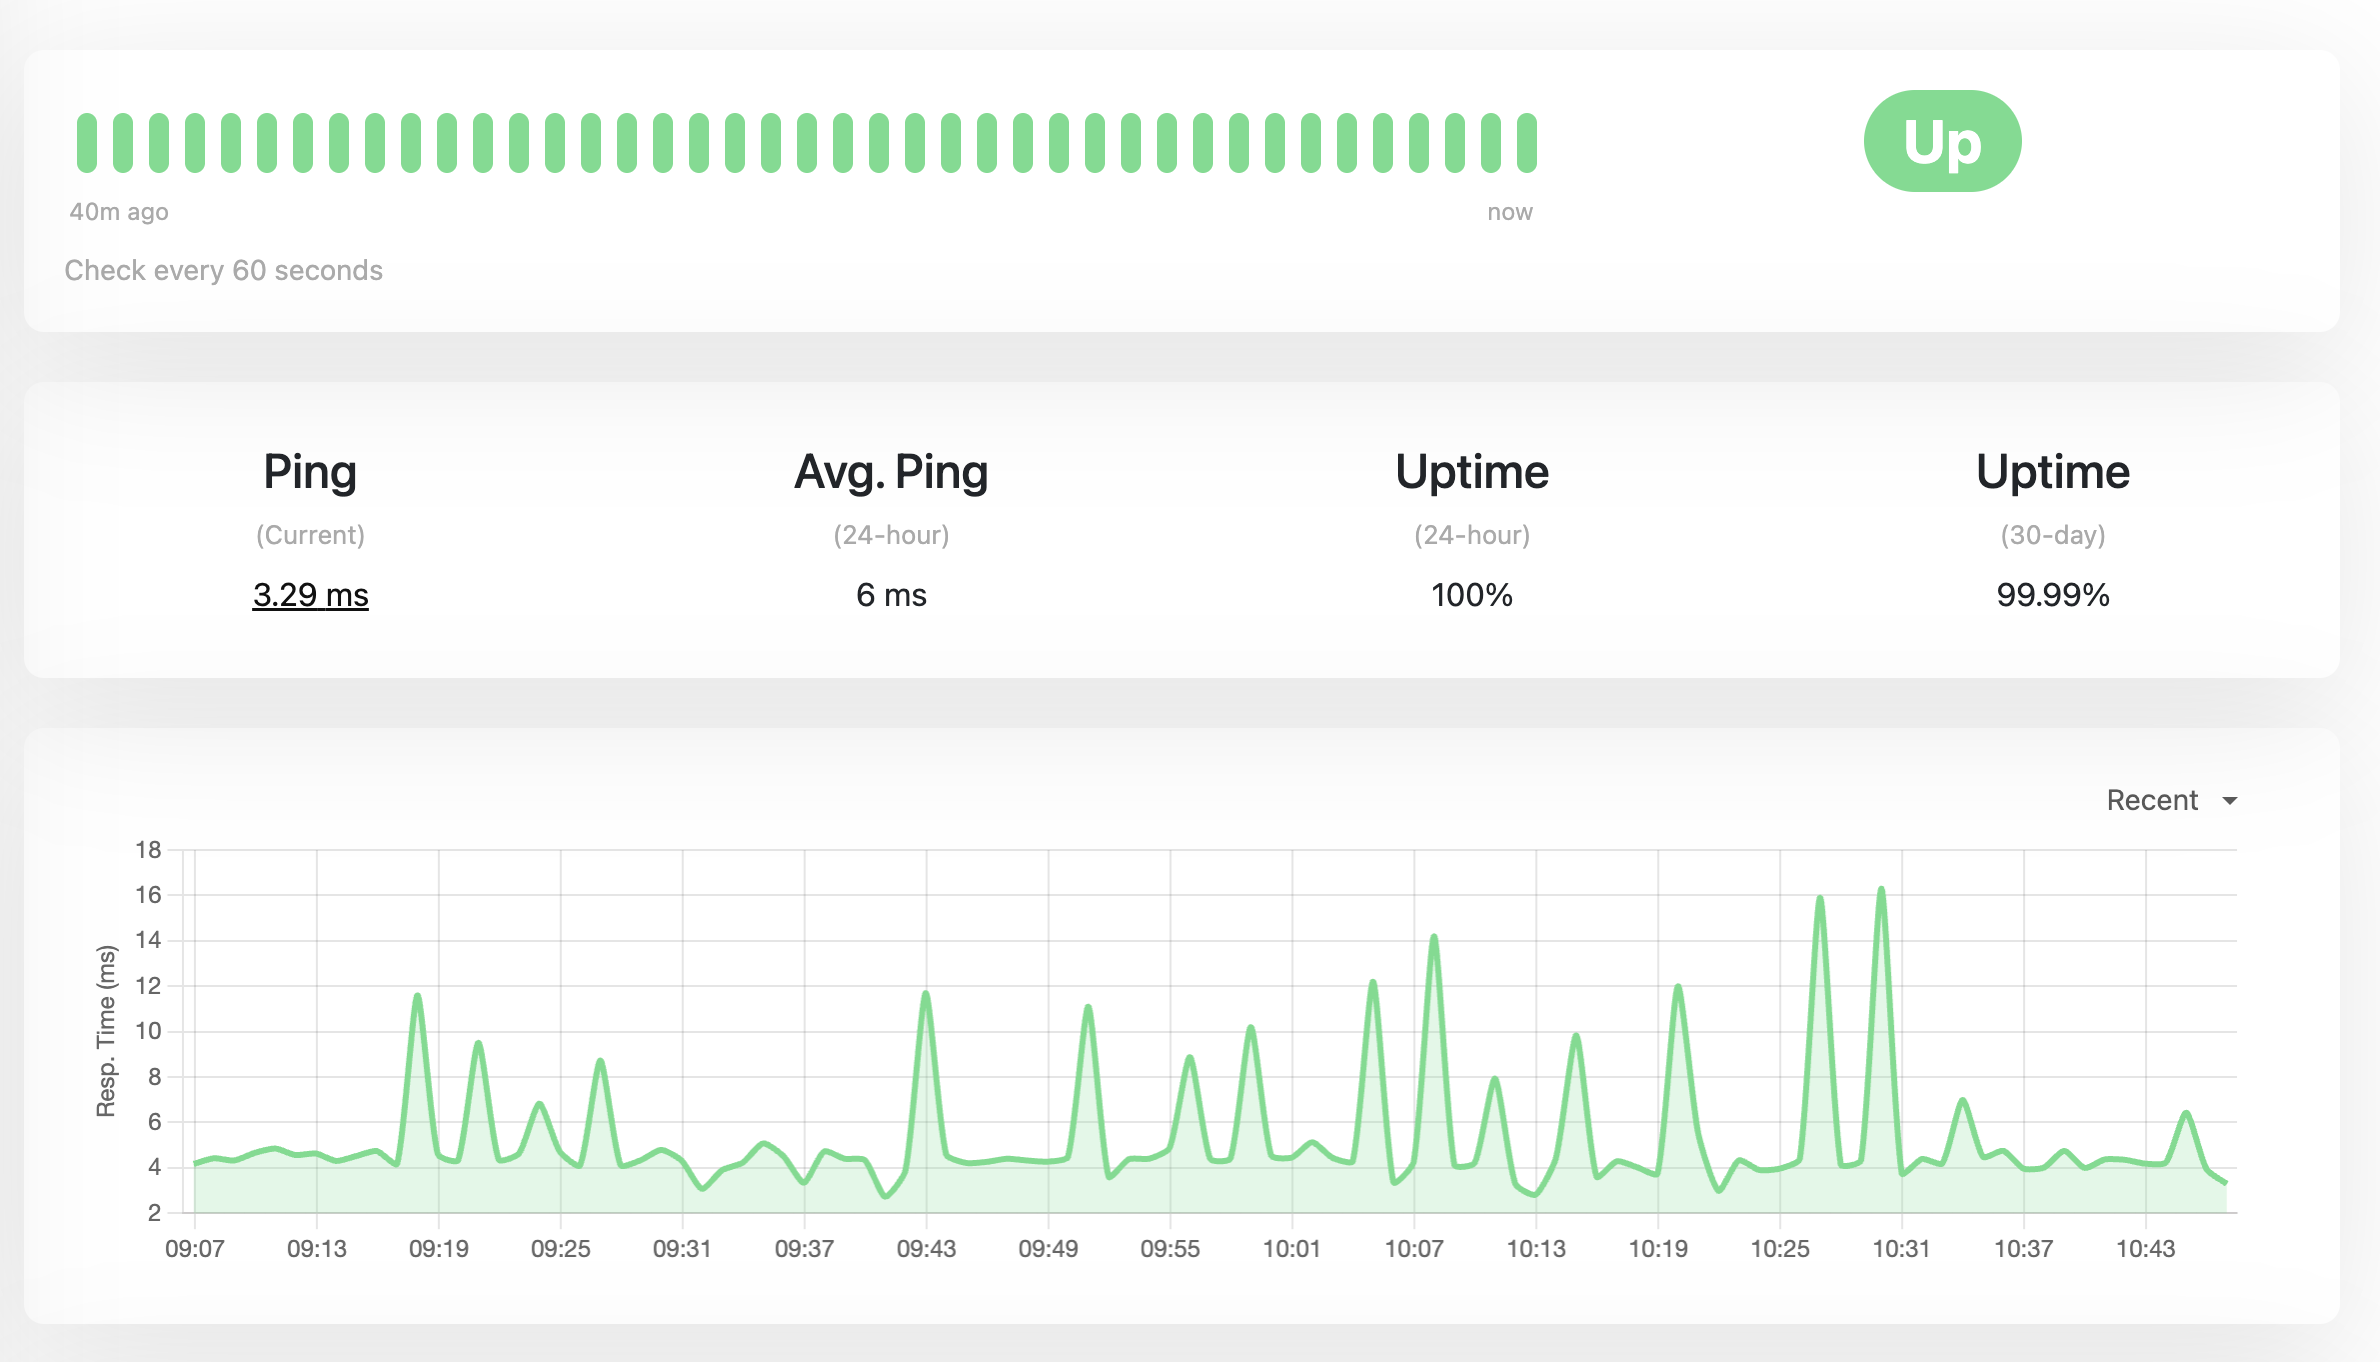
Thirty seconds is aggressive — most tutorials suggest 60 — but I wanted high-resolution graphs for exactly those nasty flap-flap-flap micro-outages that are impossible to catch by hand.
Give it a minute or two, refresh the dashboard, and the graphs start filling in. At this point you have a fully functional internet health monitor. Sitting on your laptop. Where nobody else can see it.
Which brings us to the second problem.
Part 2 — Letting the outside world in (without actually letting it in)
Here was my situation: a working dashboard on localhost:3001, and a desire to show it to people who were not me. The obvious options are all slightly awful:
Port-forward 3001 on the router. Requires a static public IP (I don’t have one), exposes my home network to drive-by scans, and I have to run my own TLS cert.
Rent a tiny VPS and reverse-proxy back home. Works, but now I’m paying for a VPS, managing a second machine, and building a WireGuard link just to show a graph.
Use an ngrokstyle free tunnel. Fine for demos, awful for “this should just stay up forever” — URLs change, free tiers rate-limit.
Then there’s the option I landed on: Cloudflare Tunnel, via the cloudflared daemon. It’s free for this kind of personal use, and the mental model is genuinely elegant once it clicks.
How Cloudflare Tunnel actually works
Most “expose my local service” tools try to punch a hole inbound into your network. Cloudflare Tunnel does the opposite: it makes a persistent outbound connection from your machine to Cloudflare’s edge network, and then keeps that connection open. When someone visits your public URL, Cloudflare already has a pipe straight to your machine — it just shoves the request down it.
The consequences are delightful:
No public IP needed. The tunnel is outbound, and outbound traffic just works on any home internet.
No router configuration. Nothing is opened, nothing is forwarded, your router has no idea any of this is happening.
No inbound firewall holes. There’s literally nothing for a drive-by scanner to find.
TLS is terminated at Cloudflare. Your visitors get a green padlock automatically, and you don’t touch a certificate file.
DDoS protection and caching come along for the ride, because Cloudflare is Cloudflare.
The one prerequisite is that you need a domain whose nameservers are pointed at Cloudflare. I’m using example.com as the placeholder throughout this post — substitute your own.
Installing cloudflared, logging in, and creating the tunnel
On Arch, cloudflared is in the extra repo, so no AUR dance. On other distros, grab it from Cloudflare’s docs — the rest of the commands are identical.
The first three things you do are: install it, log in (which is a browser flow that drops a certificate in your home directory), and create a named tunnel. I’ll batch them because they belong together:
           ┌──────────────┐
            │   Visitor    │
            │  (browser)   │
            └──────┬───────┘
                   │  1. https://status.example.com
                   │     DNS lookup → CNAME → <tunnel-id>.cfargotunnel.com
                   ▼
       ┌───────────────────────┐
       │   Cloudflare Edge     │  ◄── TLS terminated here
       │  (Mumbai, Chennai,    │      DDoS protection, caching
       │   wherever you are)   │
       └───────────┬───────────┘
                   │  2. Request routed down the
                   │     pre-established tunnel
                   │     (matched by tunnel ID)
                   │
                   │         ╔════════════════════╗
                   │         ║   OUTBOUND-ONLY    ║
                   │         ║  persistent HTTPS  ║
                   │         ║   connection(s)    ║
                   │         ╚════════════════════╝
                   │                  ▲
                   │                  │ 0. Opened at boot by
                   ▼                  │    `cloudflared` daemon
       ┌───────────────────────┐     │
       │   Home Router / NAT   │     │   (no inbound ports,
       │  (nothing forwarded)  │     │    no public IP needed)
       └───────────┬───────────┘     │
                   │                  │
                   ▼                  │
       ┌───────────────────────┐     │
       │    Your Machine       │     │
       │                       │     │
       │  ┌─────────────────┐  │     │
       │  │   cloudflared   │──┼─────┘
       │  │    (systemd)    │  │
       │  └────────┬────────┘  │
       │           │ 3. Proxied to
       │           │    http://localhost:3001
       │           ▼           │
       │  ┌─────────────────┐  │
       │  │  Uptime Kuma    │  │
       │  │  (Docker, 3001) │  │
       │  └─────────────────┘  │
       └───────────────────────┘
A quick gloss on what just happened:
cloudflared tunnel loginopens a browser page where you pick which Cloudflare zone (i.e., domain) this machine is allowed to manage. When you click Authorize, acert.pemdownloads. This is an account-level origin certificate — it lets this machine run tunnel/DNS management commands for that zone. It’s not used to serve live traffic.cloudflared tunnel create uptime-kumadoes two things: it creates a long-lived “named tunnel” object on Cloudflare’s side, and it writes a credentials JSON file to~/.cloudflared/<tunnel-id>.json. That JSON file is the secret that authenticates this machine as the tunnel. Treat it like a private key — anyone with it can run the tunnel and intercept your traffic.
The create command prints the new tunnel ID. Copy it somewhere, you’ll need it once.
Routing DNS, writing the config, and a first test
Now we need to tell Cloudflare “when somebody visits status.example.com, route it down this tunnel,” and we need to tell cloudflared “when requests arrive for that hostname, forward them to localhost:3001.” That’s a DNS route plus an ingress config.
Do all of that — plus a manual test run — in one go:
Two things to understand about that config file:
- Ingress rules are evaluated top-to-bottom, like a routing table. The first rule says “anything for
status.example.comgoes to our local Uptime Kuma.” You can add more hostnames later — just stack them above the catch-all. - That final
http_status: 404entry is required.cloudflaredrefuses to start without a catch-all. It exists to return a clean 404 for any hostname that doesn’t match the rules above it.
Once the tunnel is running in the foreground, open https://status.example.com in your browser. If everything is wired up correctly, you’ll see your Uptime Kuma dashboard — served over HTTPS, fronted by Cloudflare, from a laptop that has no public IP and no open ports. It feels a little like magic the first time. It should.
Hit Ctrl-C to stop it, because we don’t want to run it in a terminal forever.
Making it boot-proof with systemd
A tunnel you have to remember to start is a tunnel that will be down the next time you actually need it. Let’s hand it to systemd.
Create a unit file that runs cloudflared as your regular user (not root — least privilege, and the credentials already live in your home directory), then enable and verify it:
A few small choices baked into that unit that are worth naming out loud:
User=<user>/Group=<user>.cloudflareddoes not need root. Running it as your normal user means a bug incloudflaredcan’t rewrite/etc.After=network-online.target/Wants=network-online.target. On boot, wait until the network is actually up before trying to dial Cloudflare. Otherwise you get a pile of angry restarts in the logs for the first 15 seconds of every boot.Restart=on-failurewith a 5-second delay. If the process dies unexpectedly, systemd will bring it right back.
If systemctl status shows active (running) and a log line that says something like Registered tunnel connection, you’re done. The tunnel will now come up on every boot, automatically, with no input from you.
Polishing the dashboard
One last touch in the Uptime Kuma UI, under Settings → General:
- Primary Base URL →
https://status.example.com. This tells Uptime Kuma what its public address is, so generated links (email notifications, webhooks) point at the right place. - Entry Page → set it to your status page instead of the dashboard. This way, random visitors get a clean “is the internet up?” view, while you log in at
/dashboardyourself.
That’s it. The whole system is now:
- Uptime Kuma pinging the internet every 30 seconds from inside my house, storing history in a Docker volume.
cloudflaredholding a persistent outbound connection to Cloudflare’s edge, supervised by systemd.- Cloudflare answering public DNS for
status.example.com, terminating TLS, and forwarding requests down the tunnel tolocalhost:3001. - A public status page I can send to anyone, including the support agent who keeps asking “is it currently down.”
The commands I actually use day-to-day
Once it’s all running, you barely touch it. But these are the half-dozen commands worth memorising for when you do:
And two lookup commands from the cloudflared side that are occasionally handy:
When things go sideways
Three failure modes, in roughly the order I’ve hit them:
- Cloudflare error 1033 (“Argo Tunnel error”). The
cloudflaredservice is down.systemctl status cloudflaredandjournalctl -u cloudflared -n 50will tell you why. Most commonly: a typo inconfig.ymlafter an edit. - 502 / 521 from Cloudflare. The tunnel is up, but
cloudflaredcan’t reachlocalhost:3001. That means Uptime Kuma itself is down — checkdocker psanddocker logs uptime-kuma. - DNS doesn’t resolve at all. Check the Cloudflare dashboard → your zone → DNS. There should be a
CNAMErecordstatus→<tunnel-id>.cfargotunnel.com, proxied (orange cloud). If it’s missing, re-runcloudflared tunnel route dns uptime-kuma status.example.com.
One tunnel, many services, zero extra ports. It’s a surprisingly tidy way to run a home lab.
Security notes I shouldn’t have to say but will anyway
- The status page is public by design — that’s the point. Uptime Kuma’s admin UI is still behind a login, but don’t put anything sensitive on a status page you’d rather not have indexed by Google.
~/.cloudflared/should be700and owned by your user. The credentials JSON file in there is a secret. Don’t commit it, don’t share it, don’t paste it into a screenshot. If it leaks, delete the tunnel and recreate it.- If you ever want to put the dashboard behind an email-login gate (not just the admin account), Cloudflare Zero Trust → Access → Applications will do it for free for up to 50 users. That’s a whole other blog post.
What changed for me
Having the dashboard exposed has genuinely changed how I talk to my ISP. Instead of “it’s been bad lately, can you check,” I can say “here are the four micro-outages between 21:14 and 22:02 yesterday, here’s a public link, please investigate.” The graphs do the arguing for me.
More than that, though, I’m surprised by how much I enjoy the shape of this setup. Uptime Kuma doesn’t phone home. Cloudflare Tunnel doesn’t require a VPS. There’s no SaaS subscription, no account I have to remember to renew, no magic I can’t see. It’s a Docker container, a systemd unit, and a config file — three boring primitives doing one useful thing together. That’s my favourite kind of infrastructure.
If you’ve been putting off building your own little status page because the networking felt intimidating, I hope this was enough of a nudge. It is, genuinely, an evening’s work. Go poke your internet.